A startling historical record was made in 2022. See below.
**********************************************************************************
I'm sure most of us are very happy to put 2022 behind us, but I always enjoy taking a look back to put things into context as we look ahead at the new year.
The holidays and these first few days of a new year provide us with some hope and excitement of good things to come. They also provide us with just enough distance to look behind us with some objectivity.
And I haven't seen any better visual than the one shown below, courtesy of The Financial Times, to demonstrate what we've all just lived through the last year.
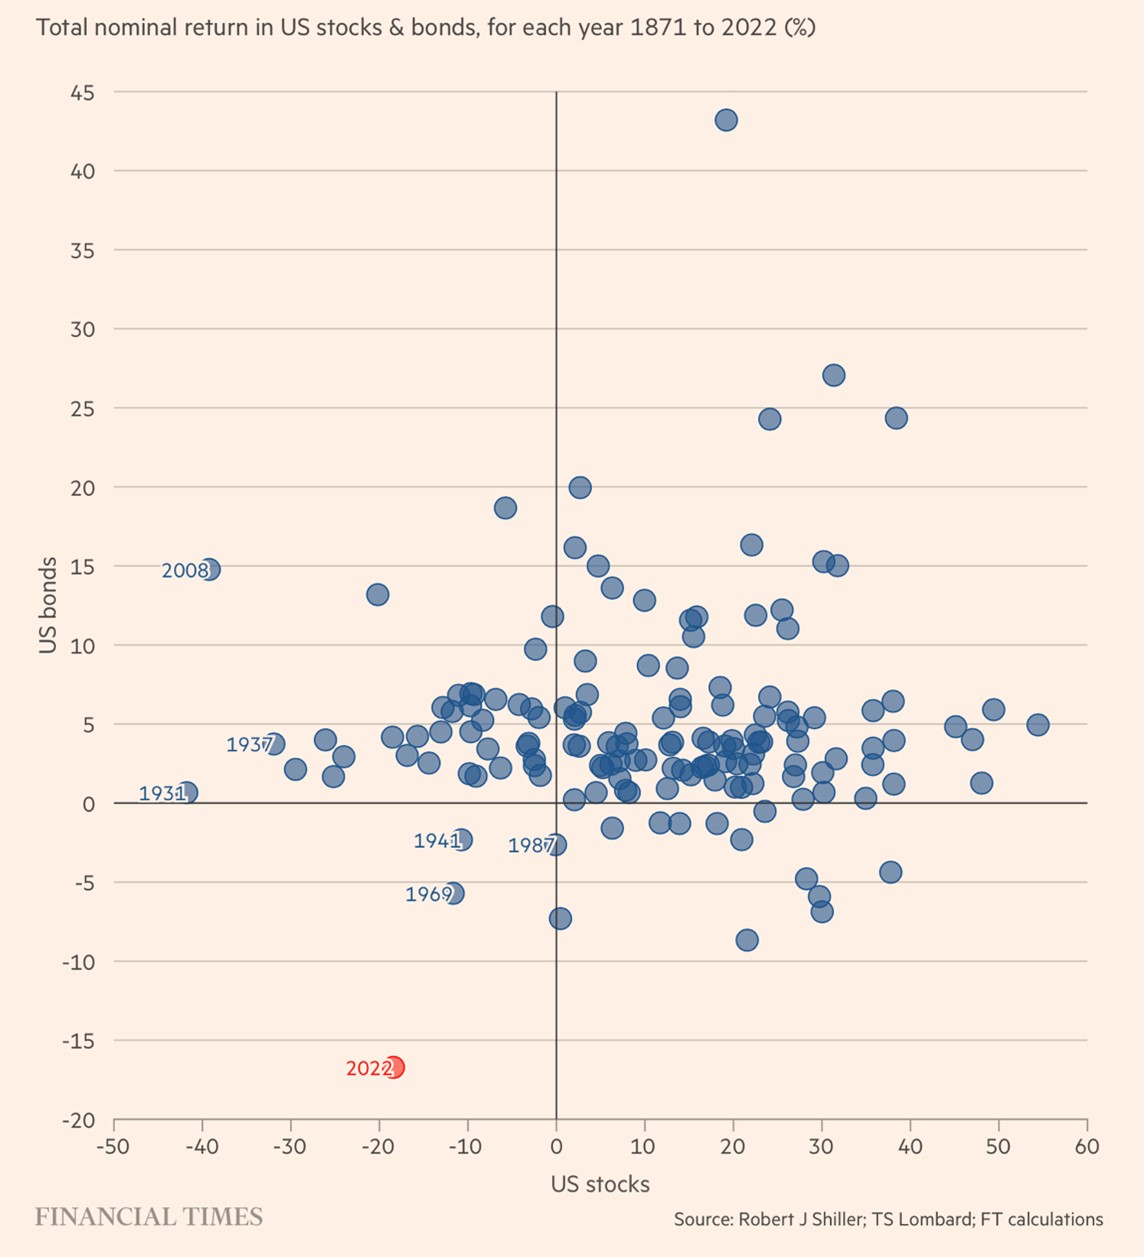
Historical Stock and Bond Returns
Source: The Financial Times
The above chart has data going all the way back to 1871. The vertical axis is the nominal return for bonds, and the horizontal axis is the nominal return for U.S. stocks.
As we can see above, most years fall into the upper right quadrant, where there are positive returns in both stocks and bonds.
The second most common quadrant is the upper left, where bonds deliver a positive return and stocks are negative.
This has been the reason why the tried-and-true 60% equity, 40% bond portfolios worked well over extended periods of time. When equities lagged, bonds tended to deliver positive returns.
As we learned last year, that's no longer the case.
There have only been three years since 1871 when both bonds and stocks were firmly in the lower left quadrant (negative): 1941, 1969 and, of course, 2022. But 2022 makes the other two years look timid.
In short, 2022 was:
The worst combined stock/bond performance since 1871.
The worst year since 1788 for U.S. long-term government bonds.
The worst performance since 1932 of the classic 60/40 portfolio.
Additionally, we saw:
A summer low for the S&P 500, when it shed $11 trillion in market cap.
The global stock and bond markets lose more than $30 trillion in value.
For added perspective, the U.S. gross domestic product (GDP) will come in at around $23 trillion for 2022. That means the S&P 500 lost the equivalent of about half the U.S. GDP. And the global markets lost significantly more than the U.S. GDP. Wow…
We've reached an inflection point. The egregious deficit spending and extraordinary levels of national debt ($31.5 trillion in the U.S.) have now caught up with us. The chickens have come home to roost.
In other words, the game's up… and now we're going to have to deal with it.
The reality is that the old adages like the 60/40 portfolio won't work anymore. The government's role in markets through monetary and economic policy is heavier than it's ever been before.
No comments:
Post a Comment