Share another bullish analysis for 2023.
*******************************************
By that measure, 2022 was a rough year. We saw 23 of those 2%-plus declines in the S&P 500 Index. And as the chart below shows, that's one of the most volatile readings we've seen in more than seven decades...
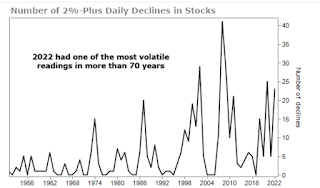
Most folks might glance at the VIX and think 2022 wasn't such a choppy year. But a different story emerges when you look at the market's daily moves.
Last year was painful for investors. Stomaching 2%-plus down days over and over isn't easy. And it might feel like this suffering has become the norm.
There's good news, though... The years that follow this kind of volatility tend to be darn good for investors.
The table below shows this. It includes each year that had 20 or more 2%-plus down days in stocks – and the returns that followed...

Volatile years like these are rare. They happen less than 10% of the time. But they have a history of setting investors up for huge gains.
Stocks returned an average of 20% over the following year. And the average gain was 34% over the next two years. Those results are easily double the typical buy-and-hold return for stocks.
In short, extreme volatility hurts. But the pain doesn't last forever. And history shows stocks have almost always outperformed after years like 2022.
No comments:
Post a Comment