No one knows for sure but we can at least make a calculated guess based on what today's price action tells us.
It has been really bullish without a question for today. However, it seems to me that the market may have already discounted or priced in a great CPI reading, i.e. an inflation reading that is cooling down a lot that will swing the Fed to pivot. Really?
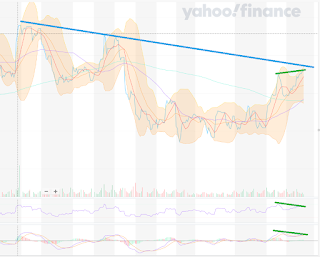
I'm not so convinced and I think the SPY chart seems to try to tell us something differently. Below is the SPY 60 min chart. You see, it is approaching its resistance (the blue line), which also presents an outstanding divergence for both RSI and MACD (the green lines).

No comments:
Post a Comment