For now, the market bullish trend remains intact. Actually the sentiment is exceedingly exuberant about markets once again, with numerous analysts suggesting nothing but "blue skies" ahead. No surprises that we are seeing new highs again. But can this trend be sustainable? Sure it can but with substantially increasing risks ahead. In this situation, being excessively complacent and not applying some risk management to portfolios will leave you flat-footed when the correction does come. And we are seeing more and more warning signs coming up, suggesting a sizable correction is on the way. I share a few below shared by my friend.
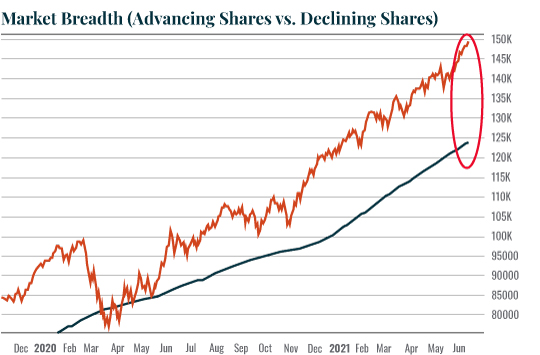
For one, the market breadth (advancing stocks vs. declining stocks) is EXTREMELY stretched above its 200-day moving average (DMA), which could be the biggest stretch in years (see the red circle in the chart below), if not in all of history.
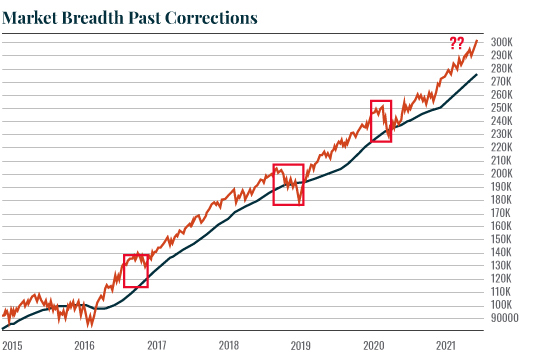
Previous episodes in which breadth was in a similar place relative to its 200-DMA saw significant corrections occur (those in the below chart with red rectangles).
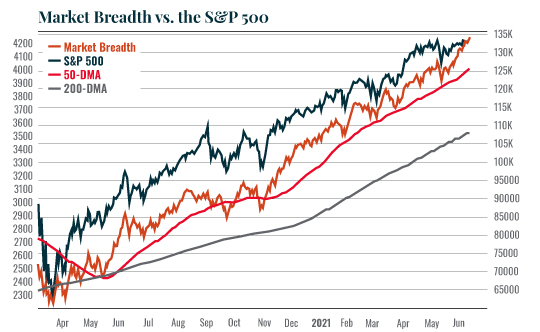
A correction in market breadth down to its 200-DMA would correspond with the S&P 500 falling to test 3,500. That seems rather extreme, but a drop to test the 50-DMA doesn't seem far-fetched. Such a drop would see the S&P 500 fall to 4,000.
Here is another one. Currently, complacency has reached more extreme levels. As noted in the chart below, the 15-day moving average of VIX, on an inverted scale, suggests a correction is likely.
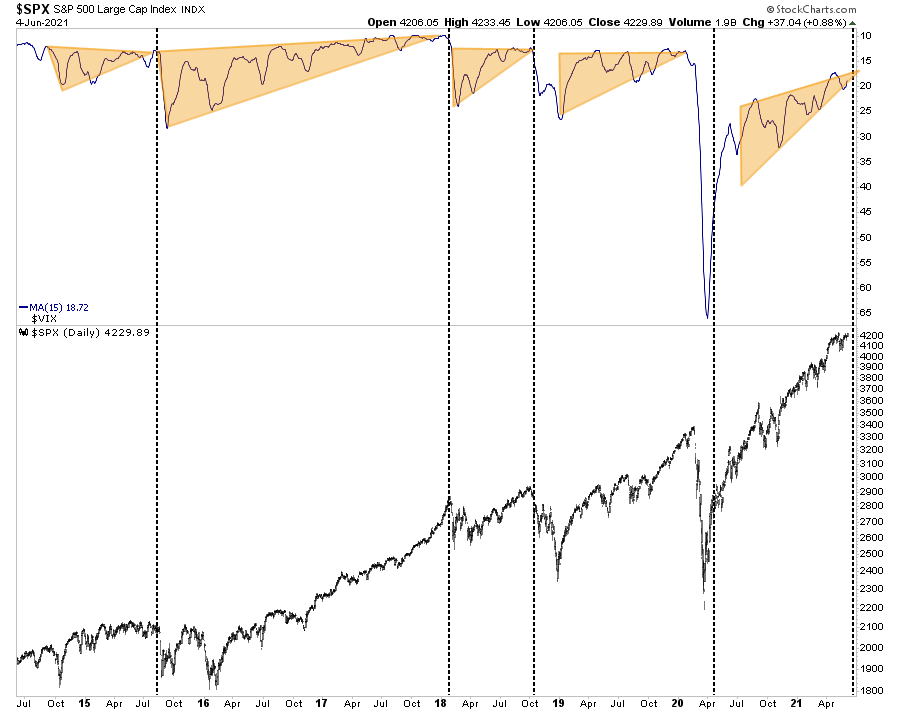
"The market may have one last push higher over the next several weeks. Such will take the VIX even lower and complete the VIX wedge pattern. That pattern has been evident in the last three 10% or greater corrections. By this measure, the correction should begin somewhere around July 21st – August 10th." – Jim Colquitt
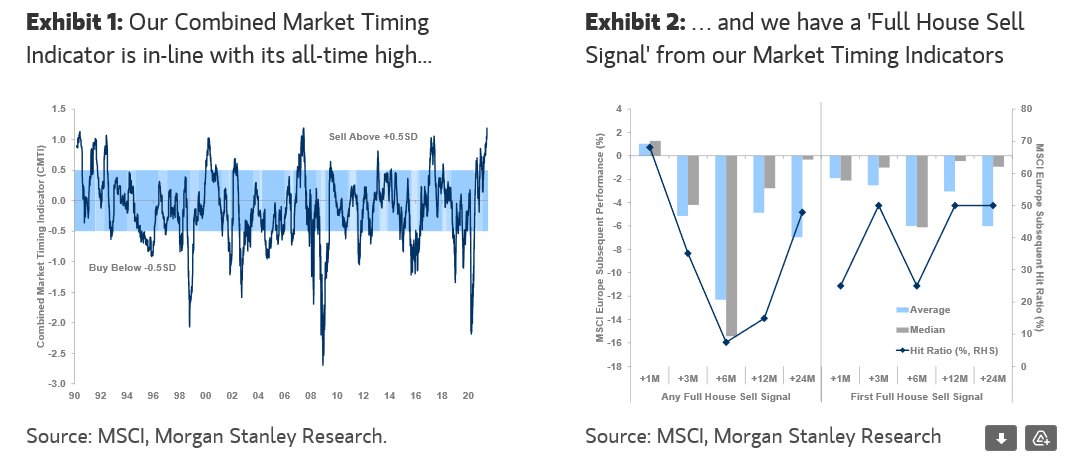
Morgan Stanley's market timing indicator is also at levels typically associated with market downturns. Just for reference, the current reading is the most "bearish" on record.
What would trigger such a collapse? There are certainly no shortages of possibilities:
- The economy rolls over.
- Inflation begins to eat into profit margins, lowering corporate profits.
- Inflation expectations soar suggesting the Fed will be forced to taper/ end its interventions and tighten monetary policy.
- A true black swan even no one sees coming (another COVID-19 variant? War? A major funding issue with a foreign bank?)
No comments:
Post a Comment