"Investors buy the most at the top, and the least at the bottom."
This is not my words but wisdom from a veteran investor!
Following the election, we start to see more signs of investors piling into stocks in earnest and actively chasing highs. Let me show you some charts to demonstrate it.
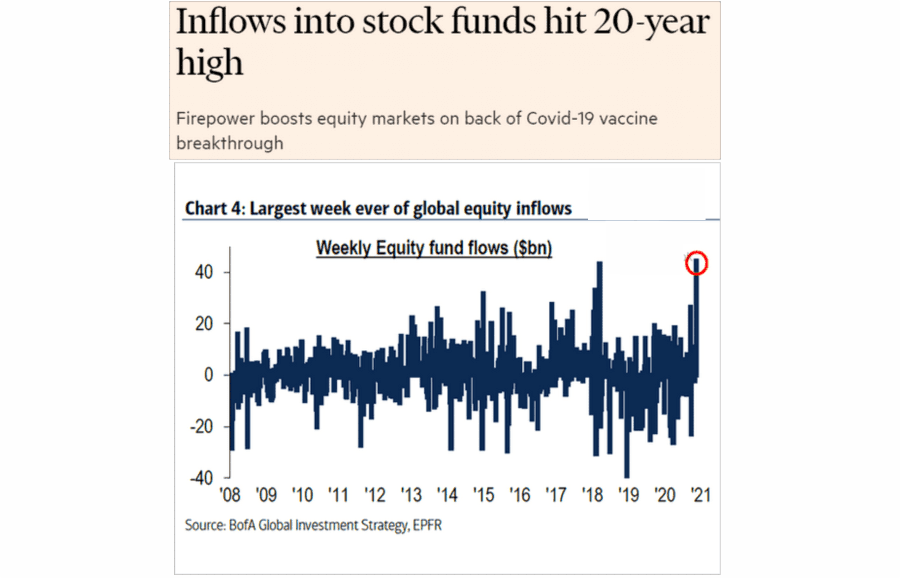
First is the money inflow into stock funds, which has recently hit all time highs. The last time we saw this type of surge was in December of 2017, followed by a near 20% decline just two months later.
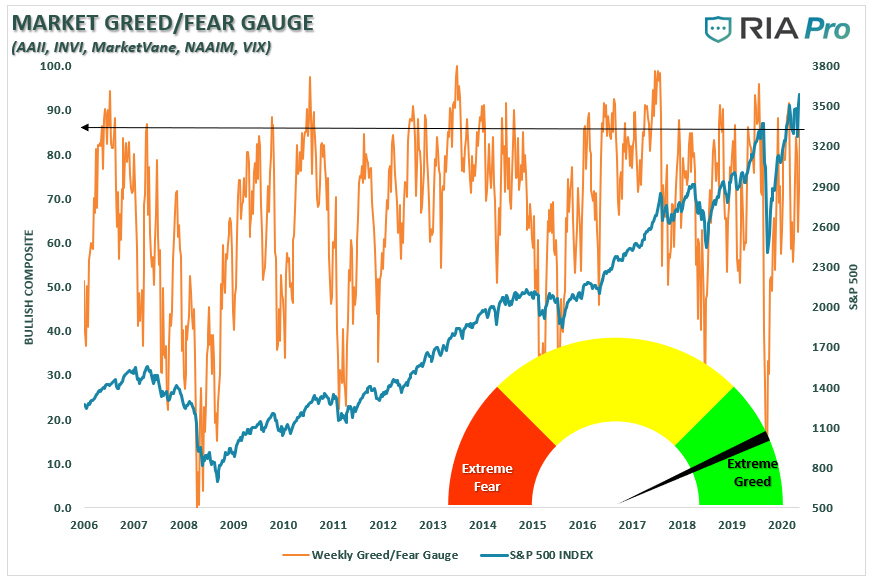
Then the famous "fear/greed" indicator, which primarily comprises investor positioning, shows much of the same as "bullish sentiment" pushes back to extremes. Do you see any fear here?
Here is another sentiment indicator, the AAII bullish sentiment, which has remained consistently depressed since March but all of a sudden, it shot up to the extremely bullish level similar to that seen before the Mar crash.
The percentage of bulls in the American Association of Individual Investors (AAII) survey rose to 55.8% while bears dropped to 24.9%, pushing the Bull Ratio, a more accurate measure of optimism, above 69%. The last 2 times it got this high, stocks ended up running into trouble eventually." – SentimenTrader
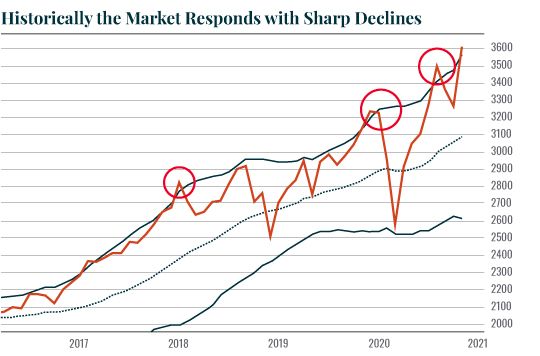
Last but not least, the last three occasions in which the S&P 500 extended three standard deviations above its average historical price as circled below were followed by a quick and sharp decline soon after. We are seeing this setup again right now!
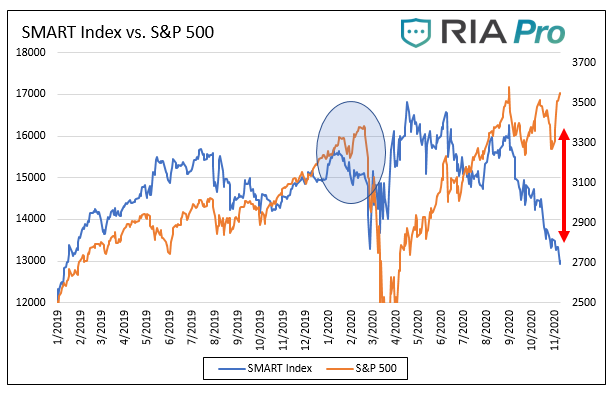
So what is the smart money doing right now when nearly everyone is hyped and chasing? They are dumping!! See the blue line below which indicates the Smart Index over the yellow line for S&P. In general, Over the last ten years, the S&P 500 and the Smart Index have a strong correlation of .65. meaning the market is generally following the smart money. But occasionally we may see some clear divergency. . The light blue circle shows they also diverged, albeit to a much lesser extent, The most recent one was observed in January and February as highlighted with the blue circle below. In the hindsight, the smart money correctly sensed problems that crashed the market in Mar. Now we are seeing even more pronounced divergency as shown in the red arrow in the chart. Does that mean the smart money is smelling something we haven't? No one knows for sure and I'm not saying a severe crash must come in the near future. But given so many reliable indicators are fiercely flashing in red, a little caution seems advisable and wise.
Of course, you don't need to believe me as I can always be wrong. 😏
No comments:
Post a Comment