If we break down the commentary and charts into critical points, we can gain some clarity.
- The market broke above resistance (bullish)
- MACD has crossed positively, issuing a "buy signal." (bullish)
- The market broke above the 50-dma. (bullish)
- The overall trend from the September highs is negative (bearish)
- MACD is back to overbought (neutral to bearish)
- Intermediate-term "sell-signals" still firm (bearish)
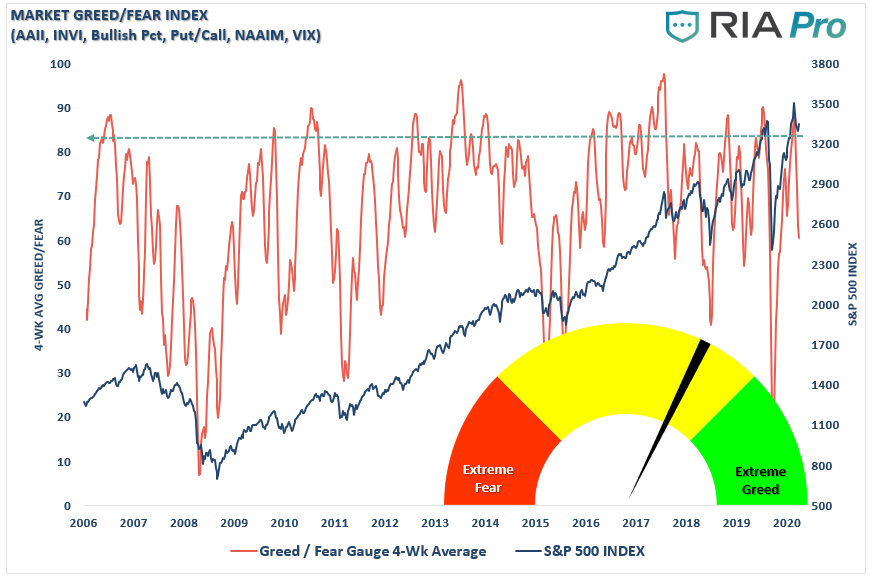
Notably, while the recent correction did reduce our fear-greed index somewhat, it remains elevated. Again, like volatility, overall investment positioning doesn't show "fear" of a deeper correction. While the indicator is currently in more "neutral" territory, it suggests gains are likely limited short-term.
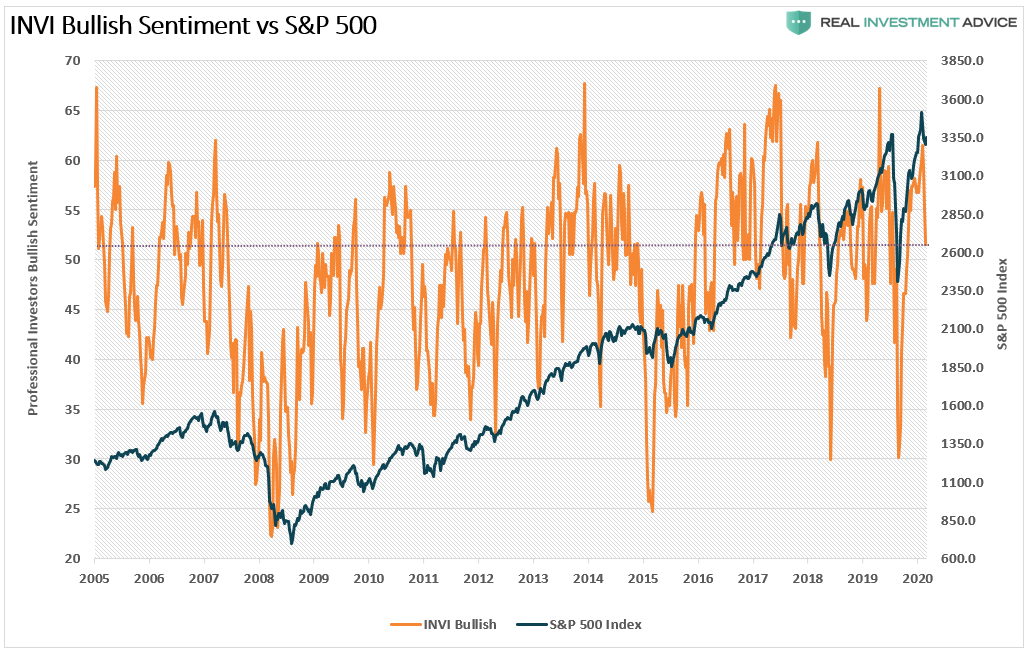
The same goes for positioning by professional investors. With positioning back to more neutral territory, any rally in the market is likely limited.
The current psychological conditions suggest the short-term bottom in the market remains intact. However, given that much of the more "bullish" exuberance was not displaced, the upside may get confined to previous highs.
As noted, much of the impetus for the rally was "hope" of more stimulus. However, currently, there is little evidence of another CARES Act occurring before the election, particularly with the Senate in recess. Such could wind up disappointing investors in the short-term, particularly as economic growth continues to wane.
Technical Concerns
From a purely technical perspective, the market remains in a long-term deviation from historical trends. The problem with long-term trend analysis, much like valuations, is that markets can "remain irrational longer than logic would predict." It is during these periods of "irrationality" where investors begin to believe "this time is different," or "such and such" doesn't matter any longer due to Central Bank interventions.
Those beliefs have, without exception, wound up costing investors more than they ever thought possible.
As noted above, on a short-term basis, if the market can clear the 50-dma, a subsequent rally back to all-time highs is certainly not out of the question.
However, when viewing longer-term time frames, the risks become more evident. As shown in the "weekly" chart below, the deviation from long-term means remains at extreme levels. Historically, these deviations correct themselves. Such a "mean-reverting" event can occur over a drawn-out period, as seen in 2015-2016. Or, it occurs rapidly, as seen in both 2018 and 2020.
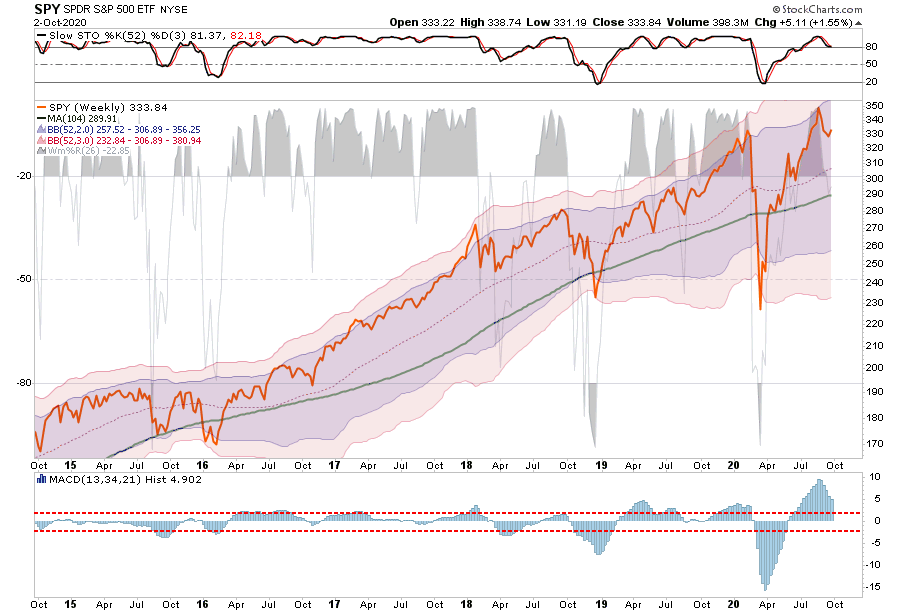
What is essential to understand is that while the short-term bullish "meme" is hard to resist, these "mean-reverting" events occur regularly. They also tend to happen when the media least expects them too.
If we take a long-term view, the "monthly" chart confirms the same. Relative-strength continues to diverge negatively, participation remains weak, and markets remain well deviated from long-term means.

The Rules
Instead, we will use rallies to:
- Re-evaluate overall portfolio exposures. Are equity exposures aligned with current market dynamics and related risks?
- Raise cash as needed. (Cash is a risk-free portfolio hedge when clear opportunities are not available.)
- Review all positions (Sell losers/trim winners)
- Look for opportunities in other markets and assets. (There is no rule you can only buy stocks. Bonds, commodities, currencies, alternative investments, annuities, etc. can all have places.)
- Add hedges to portfolios.
- Trade opportunistically. (There are always rotations which can be taken advantage of)
- Drastically tighten up stop losses. (Tighter stop-losses reduce unexpected downside exposures.)
By the way, if you are interested in joining my DW investment group, we have set up a Telegram group.
Here is the link for "DW 谈股论金": https://t.me/joinchat/SgYa_xNrjTNHk9cS51ke0A.
Importantly, you cannot join directly via Wechat. Two options:
- When open the blog in Wechat, 点击右上角的三点,然后选在Safari 中open,然后点击the link and then join
- Or copy the link and paste to Safari to open and then join
I rarely share my story with people, not only because it put me at the lowest point ever but because it made me a person of ridicule among family and friends. I put all I had into Binary Options ($125,000) after hearing great testimonies about this new investment
ReplyDeletestrategy. I was made to believe my investment would triple, it started good and I got returns (not up to what I had invested). Gathered more and involved a couple family members, but I didn't know I was setting myself up for the kill, in less than no time all we had put ($300,000) was gone. It almost seem I had set them up, they came at me strong and hard. After searching and looking for how to make those scums pay back, I got introduced to (paytondyian699@Gmail.Com) who helped recover about 80% of my lost funds within a month.