Market Breadth At Odds With Record Highs
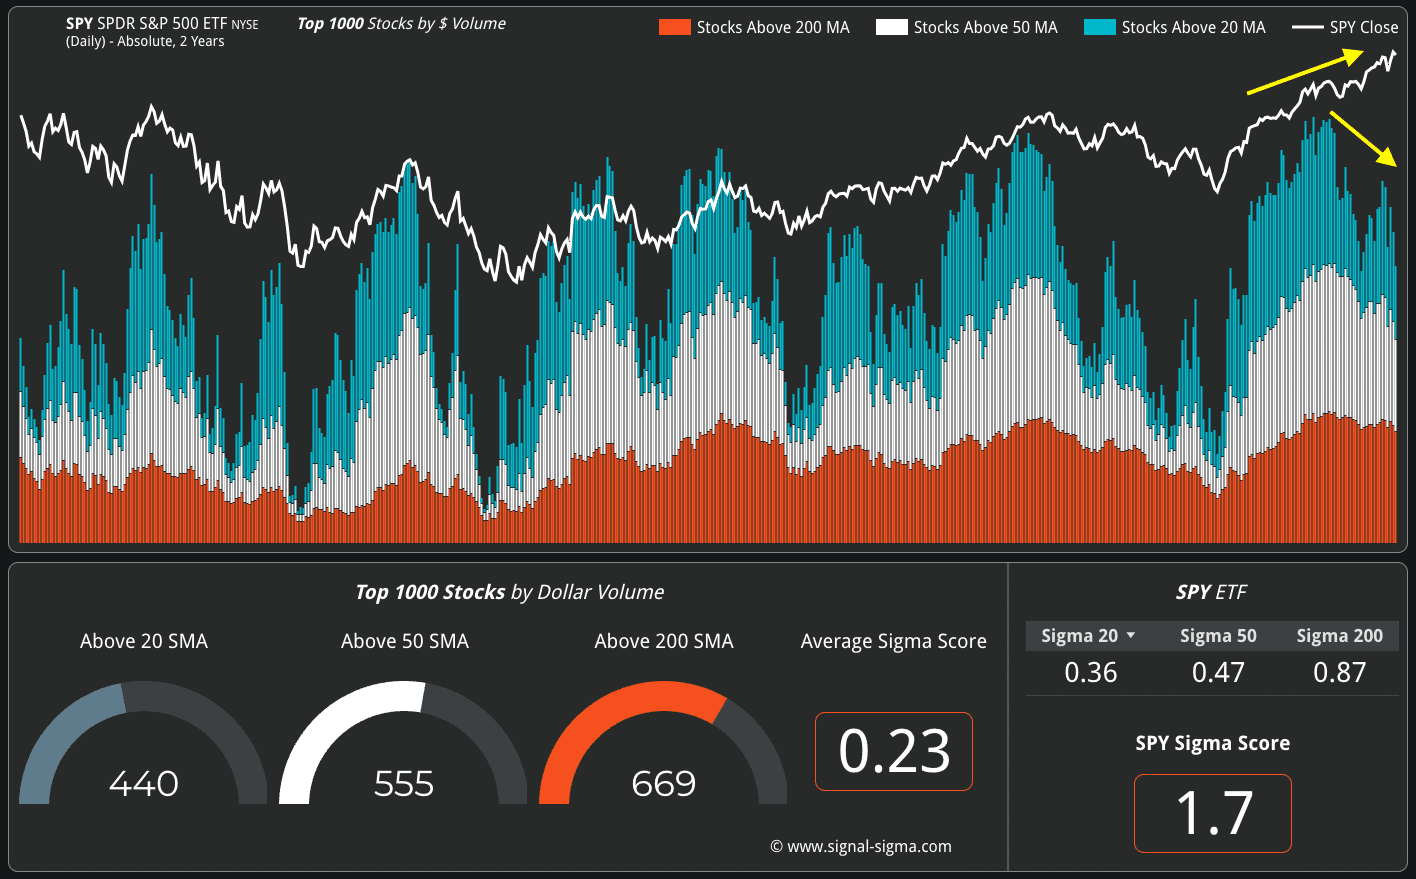
Andrei Sota shares the graph below, which shows that market breadth is weakening despite record highs. Note that prior market peaks were accompanied by peaks in the percentage of stocks above their 20, 50, and 200-day moving averages. Despite setting record highs, the number of stocks above their respective key moving averages has been falling. As we have been writing about, the fortunes of a select few stocks are driving major market indexes higher. All the while, a large number of stocks are not keeping up with the broad indexes.
To further hammer home this point, consider the following Tweet from Jason Goepfert of Sentimentrader:
Man, this is weird. The S&P 500 is within .35% of a 3-year high. Fewer than 40% of its stocks are above their 10-day avg, fewer than 60% above their 50-day, and fewer than 70% above their 200-day. Since 1928, that’s only happened once before: August 8, 1929.
No comments:
Post a Comment