Total Pageviews

Saturday, April 2, 2022

XOM is mining Bitcoin

One of the biggest complaints against Bitcoin is that it is not green as it requires a lot of energy to mine it. Nevertheless, Bitcoin is a huge financial revolution that will totally change how we will live in nearly all aspects in our life. As such, I firmly believe that we as human beings will explore various innovative and creative ways to meet this challenge. Here is one example that XOM is making Bitcoin greener!🤗

*********************************************************************************

What do oil drilling and crypto mining have to do with each other?

You might not think very much… 

I didn't. 

At least, not when I first heard about ExxonMobil's (XOM) recent move to start mining Bitcoin in the Bakken region—a massive shale formation largely located in North Dakota. 

It's normal for big businesses to expand outside of their core areas of expertise. Sometimes the moves make sense—like Apple developing an in-house payment processing system… And sometimes they're hard to comprehend—like movie theater chain AMC buying a gold mine.

While Exxon's move might seem confusing at first glance… a deeper look shows a reasonable long-term story…

You see, Bitcoin mining—the process of bringing new coins into existence—is a power-hungry enterprise. 

The "mining" process is extremely high-tech… and requires massive computers running day and night to solve a series of complex mathematical equations in the original problem designed by Bitcoin creator Satoshi Nakamoto (the name is, really, a pseudonym). 

The beauty of Bitcoin is that there's a strictly limited number of solutions to the original problem—meaning that there's a limited supply of Bitcoins that will ever exist… Once they've all been mined, that's it. 

As more coins are mined and the number of remaining solutions to the original problem dwindles further… it takes more processing power to crunch the numbers, mine new coins, and register them on the network. 

These massive computer farms running 24/7 demand electricity… and a lot of it.

And this is where Exxon comes in… 

As a byproduct of oil extraction, a significant amount of natural gas—methane—is often released. 

Depending on the location of the oil well, it might not be economically feasible to capture this natural gas… and use it to generate energy. Instead, it gets burned off—flared—at the site. And some methane just escapes, polluting the atmosphere. 

The amounts of wasted methane at these oil well sites can be massive… In 2019, this waste represented nearly 2% of all natural gas produced (according to official numbers). But this number is likely significantly underestimated. 

Any project that can cut down on methane—a potent greenhouse gas with global warming impact more than 25 times greater than carbon dioxide—could be extremely valuable. 

The solution reportedly being explored by Exxon: divert natural gas that would otherwise be burned off into generators… convert the gas into electricity… and use this electricity to power mobile Bitcoin mining factories. 

The world will be using—and drilling—oil for the foreseeable future… and highly polluting methane will continue to be a frequent byproduct. The more of this otherwise wasted gas can be used for Bitcoin mining, the better. 

This is a positive development for the crypto-mining industry… and good news for anyone who's been avoiding Bitcoin purely out of environmental concerns.

Friday, April 1, 2022

Ominous sign

The market has finally broken down from its recent top around 4640ish for S&P and then got a haircut by 100 points within two days. I opened numerous trades for shorting S&P at various levels. While not all of them worked out in profit, most of them rewarded me quite well with such a swift downdraft. Although we may see a bit of a bounce from here, I don't think the mini correction is down. Any early rally next week will likely be followed by another selloff.

For the longer term in a few month time, the risk in general is even bigger. Below is an analysis on this mega risk from an interesting perspective. Thought to share with you. 

+++++++++++++++++++++++++++++++++++++++++++++ 

Over the past six months, the Consumer Staples Select Sector SPDR Fund (XLP) is up roughly 10%. This exchange-traded fund ("ETF") is packed full of defensive companies...

Its top five positions are Procter & Gamble (PG), Costco Wholesale (COST), Coca-Cola (KO), PepsiCo (PEP), and Philip Morris International (PM). The ETF also holds other big names like Walmart (WMT), General Mills (GIS), Hershey (HSY), and Colgate-Palmolive (CL).

Consumers won't stop buying from these companies unless the world comes crashing down. The products they sell are "essentials" – like toilet paper, cereal, and toothpaste. That's what makes them perfect defensive investments in hard times.

The S&P 500 Index, our broad measure for the stock market, is only up around 6% over the same six-month period. In other words... consumer staples are outperforming the market.

Now, I should be clear... That doesn't mean a bear market is imminent.

But it does mean that Wall Street's brightest minds think now is a good time to prepare for one. And when that's the case, you'd better make sure you're preparing, too.

Fortunately, consumer-staples stocks are a great way to do that...

The following table shows how XLP, the S&P 500, and the tech-heavy Nasdaq Composite Index all fared during three major sell-offs over the past couple of decades. Take a look...

The data makes it clear... When the market falls apart, consumer staples hold their footing.

Sure, the sector fell during those three sell-offs. But in each case, the declines weren't as bad as the incredible destruction in the broad market and tech stocks.

That's an ominous sign.

Wednesday, March 30, 2022

Recession is coming....

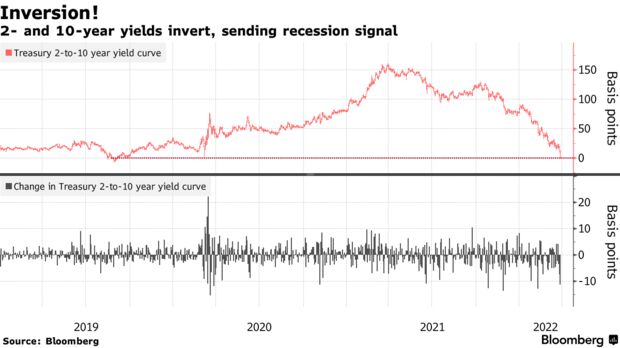
Closely watched yield curve inverts, flashing recession signal! This is what was reported by Bloomberg.

The U.S. two-year yield briefly exceeded the 10-year Tuesday for the first time since 2019, inverting yet another segment of the Treasury curve and reinforcing the view that Federal Reserve rate increases may cause a recession.

The inversion occurred as two-year yields rose while 10-year yields declined, crossing at a level of about 2.39%. Prior to 2019, when the curve inverted in August during a U.S. trade spat with China, the last persistent inversion of the Treasury curve occurred in 2006-2007.

Short-term yields that are higher than long-term yields are abnormal, and they signal that high levels of short-term yields are unlikely to be sustained as growth slows. The inversion of the two- to 10-year segment of the Treasury curve is the latest in a series beginning in October, when 20-year yields topped 30-year yields. The widely watched gap between five years and 30 years also turned upside down this week, something that hasn't happened since 2006. 

2- and 10-year yields invert, sending recession signal


"Historically, a recession has not happened without an inversion," said Ben Emons, global macro strategist with Medley Global Advisors LLC. "So likely, it will be a predictor of a future recession. Timing, however, is unknown. It could take up to two years."

Monday, March 28, 2022

Great news!

拜登给人的的正常印象似乎不如川普那么讨喜,无论是美国还是中国的舆论,都喜欢给拜登贴上很多无趣的标签。

被低估的拜登

比如很多观点认为,拜登作为高龄总统,可能有老年痴呆的症状,被川普称为"睡王"。再加上拜登经常口吃,很多人觉得他是一个很昏聩的人,将带领美国走向衰落。

图片

也有观点认为拜登是个好色之徒,动不动占女性便宜,甚至有恋童癖倾向,因为拜登经常对女童做出一些看似猥亵的动作。

图片

甚至有观点认为拜登不仅能力有限,身体也可能有问题,登个飞机都能摔倒三次,可能都活不过总统任期,并传言副总统哈里斯随时准备接拜登的班。

随着俄乌战争的持续,NBC新闻的一项最新民调显示,70%的美国人对总统拜登处理俄罗斯入侵乌克兰问题的能力缺乏信心,80%的人表示担心这场战争可能会涉及到核武器,并将继续推高油价。

在美国40年来最严重的通胀飙升期间,绝大多数人表示,他们认为国家正走向错误的方向,不赞成拜登对经济的处理。

该民调发现,拜登的总体支持率下降到40%,是他担任总统以来的最低水平。55%的受访者不满意他作为总统的表现。NBC新闻1月份进行的一项民意调查显示,对拜登工作表现的支持率为43%,54%的人不满意他的表现。

调查还发现,在11月的中期选举前,对于哪个政党应该控制国会的问题,共和党人的支持率领先2个百分点。

"民意策略"的共和党民意调查专家比尔·麦金塔夫说:"这项民调显示,拜登总统和民主党人将面临一场灾难性的选举。"麦金塔夫和哈特研究协会的民主党民意调查专家杰夫·霍威特共同进行了这项调查。

该调查是在3月18日至22日进行的,在拜登出访欧洲之前。

Sunday, March 27, 2022

Is the market setting up a trapped long?

There are two schools of thoughts regarding the current market status:

Several things currently suggest a follow-through rally is possible, encouraging the "bulls" to declare the "bottom is in."

  1. Extremely negative investor sentiment.
  2. High cash levels
  3. Low equity positioning by fund managers.
  4. Equity fund flows are strong.
  5. Stock buybacks remain strong

But other issues suggest this rally may be limited to the upside, keeping this a more tradeable rally.

  1. Liquidity that drove the rally from the 2020 lows is reversing.
  2. The Fed is hiking interest rates
  3. Inflation is hot
  4. Earnings will slow along with economic growth.
  5. There are a lot of "trapped longs" that need an exit.
No one knows for sure of course which way the market is going. I'm inclined to believe the latter that the market may be setting up a big trapped long, enticing as many people into it as possible before making another major strike! 🙄

Technically, S&P has bounced above its multi-month downtrend line as well as several major resistance lines, a quite bullish achievement. But it has also been quite overbought and quite likely it will come down to test its downtrend line around $4250ish in the next week or two. I definitely won't chase the market at the moment but trading more to the downside. 😜


Friday, March 25, 2022

Will high mortgage rate kill the housing bull?

We all know housing is in a great bull market and is still going strong.  The big question is whether this bull run can last in a world with surging mortgage rates and "hyperinflation", both of which are directly impacting the housing market. Here is some good information that can answer the question whether high mortgage rates can kill the booming real estate market. Enjoy it!

**************************************************************************

Many must be wondering if the recent surge in mortgage rates will put the brakes on rising real estate prices. After all, conventional wisdom often cites that rising rates means falling real estate prices.

But it also cites that rising inflation is good for real estate prices…

Now, we have both forces at work.

So which affects real estate more, inflation or rising rates?

History tells us it's inflation, and that when it comes to real estate prices, rate fluctuations are simply market noise.

Take a look at this chart of median home prices (blue line) and mortgage rates (red line) from 1971 to 2021…


The last time we saw this level of inflation and rates rising this fast was in the 1970s. Back then, home prices were undeterred.

From 1971-1981, when rates more than doubled from around 7% to 16.5%, real estate prices rose 175%.

Over this 50-year period, there were 19 years where mortgage rates went up, yet home prices still rose 8% on average.

Based on this, one would think that during the years where mortgage rates dropped, we would see real estate rise even more.

After all, it's more attractive to buy real estate when your interest expenses are lower – but it's the opposite.  

Thursday, March 24, 2022

A rare sell signal is triggered

The market is in an euphoric mood at the moment and all the sudden it seems everyone is more bullish than bearish, a change of the mood from extremely depressed to euphoric within just a week or two. However, we have just see a rare sell signal triggered. See below an analysis forwarded by my friend. 

I'm certainly not chasing this market right now. Using special option setups, I'm betting on the downside with a small risk for a potential 3-5 times return. Granted, in this headlines-driven market, it is not easy to trade when the market direction can change within hours or even minutes. But still betting against the extremes of sentiment is generally a winning strategy. So I'm risking a little for a big reward!😜🤗

*****************************************************

VIX sell signals are rare. And, they're not all that bad… at first.

The two previous sell signals led to immediate (but shallow) declines. In each case, the S&P 500 lost about 2% over the next week or so. That's about 100 points on the S&P 500 in today's environment.

Following those brief declines in late November 2019 and August of 2018, the S&P 500 bounced back and rallied to even higher levels. So, if we follow that road map, traders ought to be looking to buy if the S&P 500 dips back down into the 4350-4400 range.

But (and this is a big but) …

Both of those previous VIX sell signals occurred about three months before the stock market was hit with a far more significant decline. Traders might remember December 2018 – when the S&P 500 dropped 16%… and the start of the COVID pandemic, which inspired a 29% collapse in the stock market in March 2020.

Granted… we only have these two examples. And, it's probably unwise to draw conclusions from such a small sample size.