This is a bit long but quite informative and interesting. It has provided tons of data to support the projection that a recession is coming. Don't trust the FED for the "soft landing" illusion.
*********************
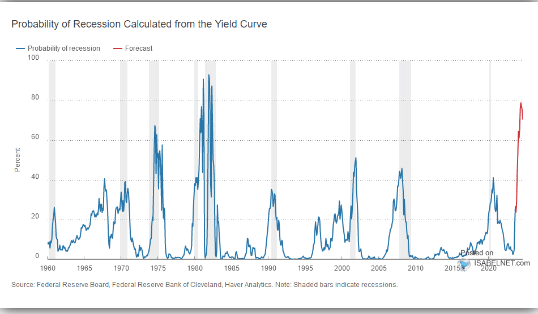
In past articles, we reviewed many indicators that typically preceded recessionary onsets. Falling tax receipts, inverted yield curves, student loan payments, leading economic indicators, and even our economic composite confirm that recessionary risks remain elevated. As shown, based solely on the inverted yield curve alone, the probability of a recession is at one of the highest levels since the 1980s.
- 1988 – Led to a recession in 1991
- 1994 – Led to a crash in the bond market.
- 1999 – Preceded the Dot.com crash and recession
- 2004 – Led to the Financial Crisis
- 2015 – Preceded the EuroZone crisis and the Fed’s Taper Tantrum
- 2022 – Recession in 2024?
****************************************
World’s Worst Economic Forecasters
As noted, Wednesday’s Federal Reserve rate decision was not a surprise. The overall language of their statement barely changed, and the expectation of “higher for longer” remained. The potential of an additional rate hike later this year spooked the markets on Thursday.
However, keeping the possibility of an additional rate hike on the table was prudent as the markets would have perceived any other statement as “dovish” and that the Fed was done hiking rates. As Justin Lahart wrote for the WSJ:
“The Fed projecting one last rate increase is also a way of preventing investors from immediately turning to the next question: When will the Fed cut? The risk is that as soon as investors start doing that, rate expectations will come down sharply, and with them, long-term interest rates, providing the economy with a boost the Fed doesn’t want it to receive just yet.”
That is right. Since October last year, the market has been hoping for rate cuts and running up asset prices in advance. Of course, higher asset prices boost consumer confidence, potentially keeping inflationary pressures elevated. Keeping a rate hike on the table keeps the options for the Federal Reserve open.
As the WSJ noted:
“Fed Chair Jerome Powell said that officials didn’t need to decide yet whether to lift rates again after a historically rapid series of increases over the past 18 months and as they await evidence that a recent inflation slowdown can be sustained. As Jerome Powell stated, ‘Let’s see how the data comes in. They want to be convinced. They want to be careful not to jump to a conclusion.’”
However, what seemed to spook the bond and stock markets was that Fed officials indicated they expect to keep rates higher for longer through 2024 than they anticipated earlier this year. Such quelled hopes of a return to monetary accommodations anytime soon and shifted the expectations for cuts forward.
This push forward of rates is based on the idea that the economy remains strong, creating a resurgence of inflation later this year.
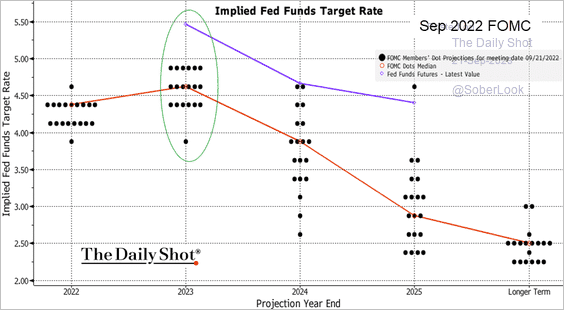
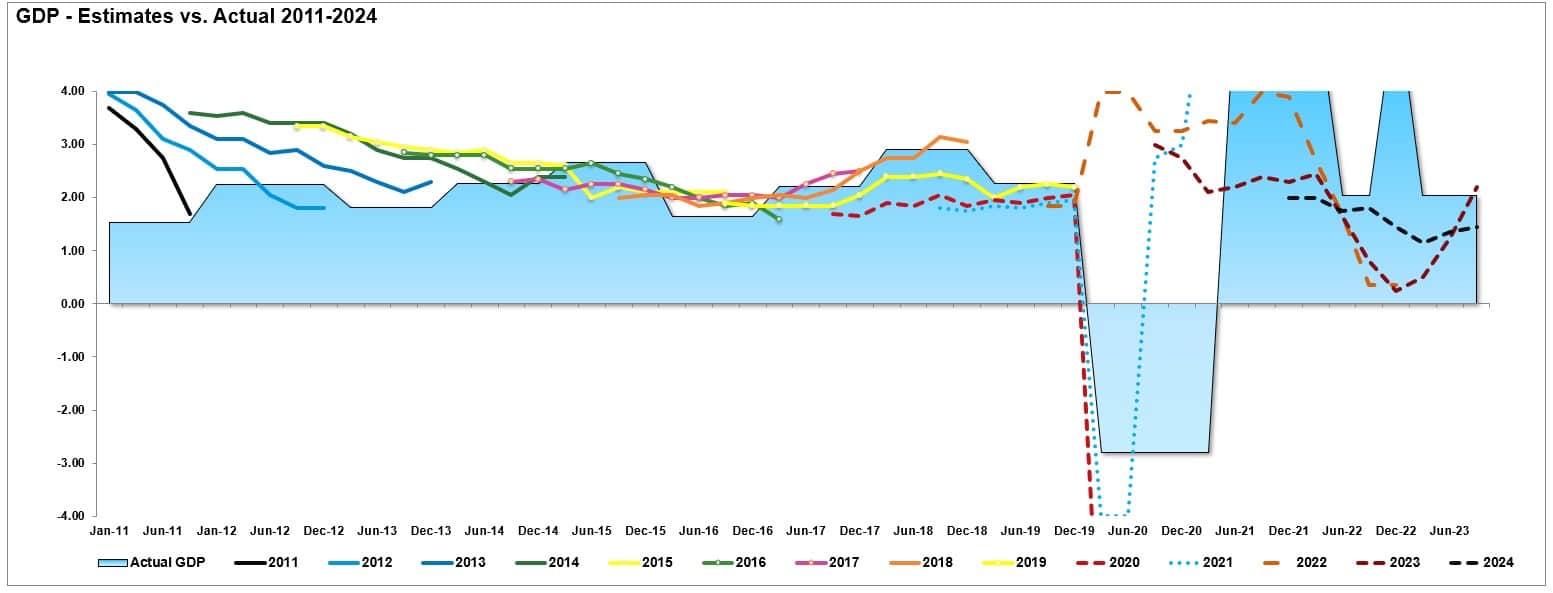
However, there is a problem with the Fed projections. They are historically the worst economic forecasters ever. We have tracked the median point of the Fed projections since 2011, and they have yet to be accurate. The table and chart show that Fed projections are always inherently overly optimistic.
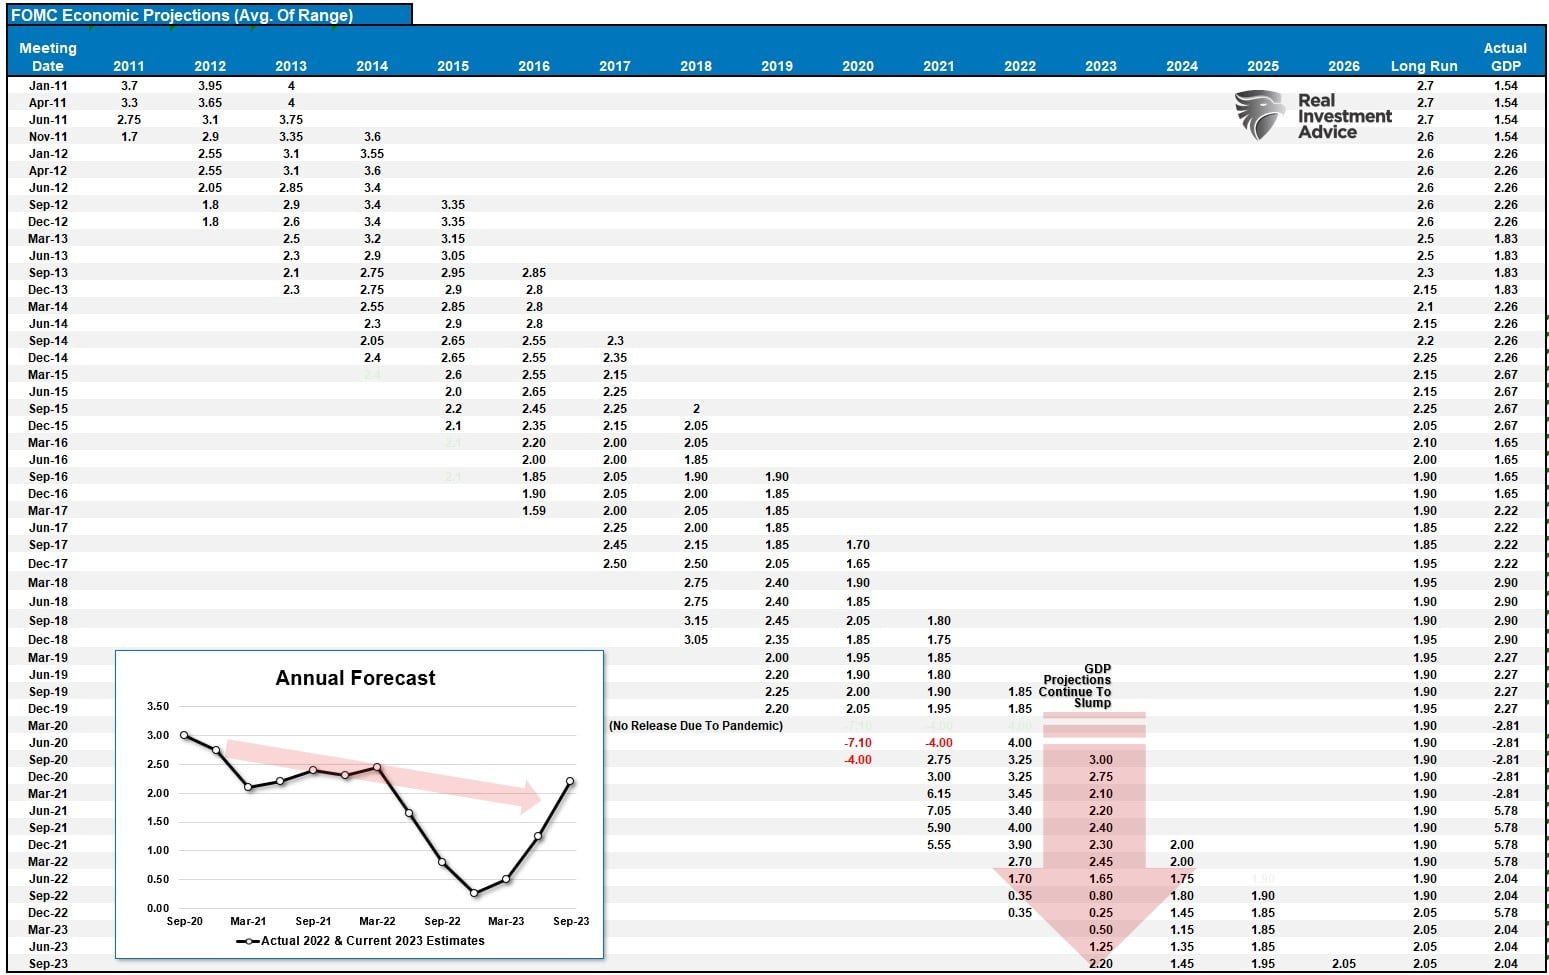
As shown, in 2022, the Fed thought 2022 growth would be near 3%. That has been revised down to just 2.2% currently and will likely be lower by year-end, as we will explain momentarily.
Here is the graphical version of the Fed projections. Like Wall Street analysts with earnings estimates, the Fed’s projections are always initially overly optimistic and guided lower to reality.
While the Fed is pushing a “no pivot” stance, there is good reason to expect a pivot in 2024.
A 2008 Redux?
The Federal Reserve’s current policy rate is the highest since 2008. If you don’t remember what happened, then let me remind you.
In January 2008, the Fed was aggressively hiking interest rates amid a massive real estate bubble under the Chairmanship of Ben Bernanke. At that time, there was “no recession” in sight, “subprime mortgages were contained,” and it was a “Goldilocks economy.”
Eight months later, the market fell sharply, banks were on the brink of bankruptcy, and the economy was entrenched in a massive recession as Lehman Brothers filed for bankruptcy.
The Fed projections NEVER include the risk of a recession, and today, like then, it believed it could navigate a soft landing in the economy. They were wrong on multiple counts. As we showed previously, there are ZERO times in history when the Fed was hiking rates that outcomes were not bad to awful. After rates peaked and yield curves UN-inverted, recessions, bear markets, and crisis events occurred.
The Fed will likely be surprised again in the next few months as the lagging economic data they focus on gets revised sharply lower. One of the main reasons is a subject we covered in detail in “Economic Data Diverges.” To wit:
“Therefore, given that GDI measures the income side of the equation (derived from production), it is logical that GDI should track pretty closely to GDP over time. Furthermore, it should be logical that deviations between production and consumption should indicate a shift in the economic underpinnings.”
A Catch Down Is Coming
However, the deviation starting last year between those two measures is quite apparent and begs the question of whether this Is an anomaly or not.
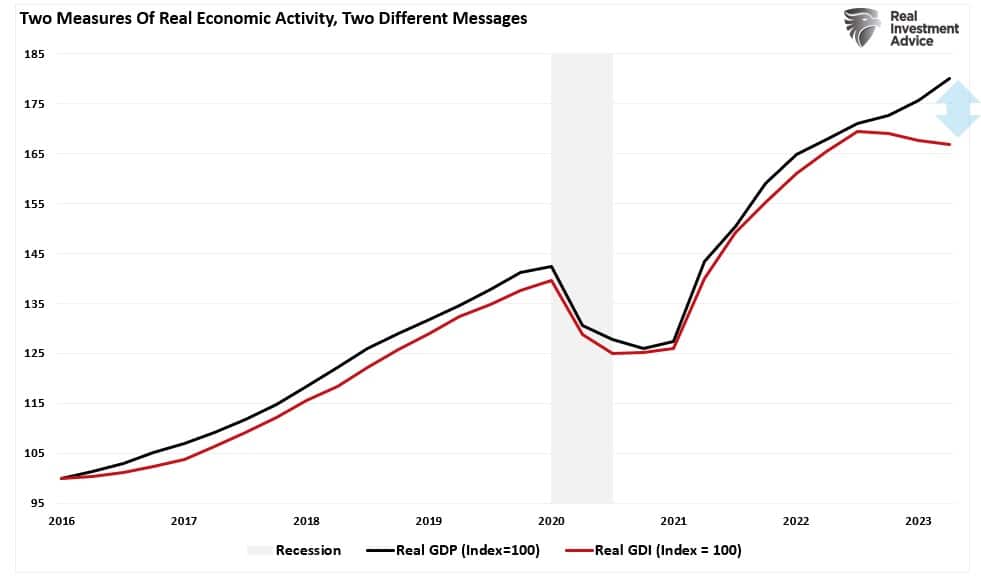
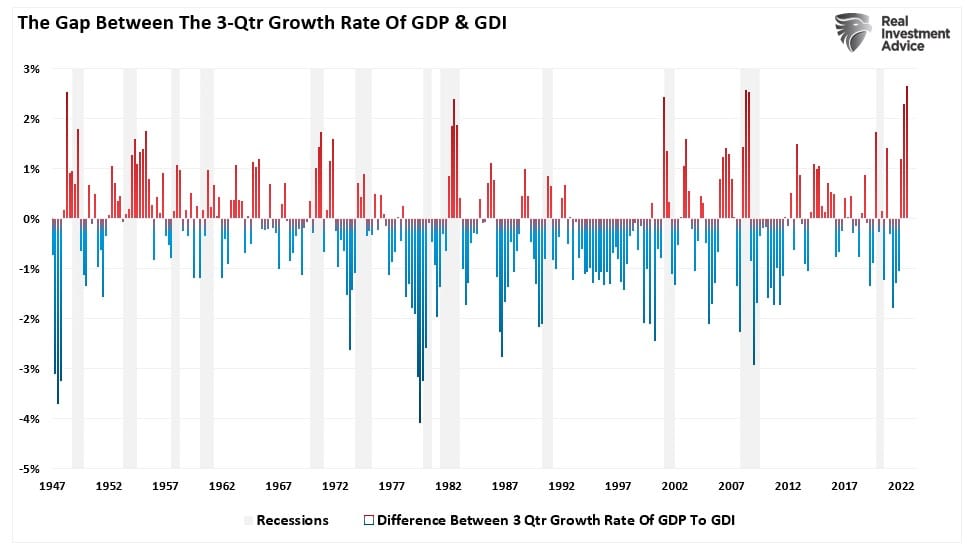
The chart below looks at real GDP and GDI back to 1947 and measures the deviation between the 3-quarter growth rates of each. With only the expectation being in the late 70’s, a recession followed each time GDP deviated from GDI. In other words, the economic activity eventually catches down to the primary driver of consumption: production. Currently, the deviation of GDP from GDI is the largest on record.
In past articles, we reviewed many indicators that typically preceded recessionary onsets. Falling tax receipts, inverted yield curves, student loan payments, leading economic indicators, and even our economic composite confirm that recessionary risks remain elevated. As shown, based solely on the inverted yield curve alone, the probability of a recession is at one of the highest levels since the 1980s.
Given the wide range of other confirming indicators previously discussed, there is a high probability that the Fed will cut rates in 2024 as GDP is revised to what GDI tells us about the economy.
Soft Landings Are Extremely Elusive
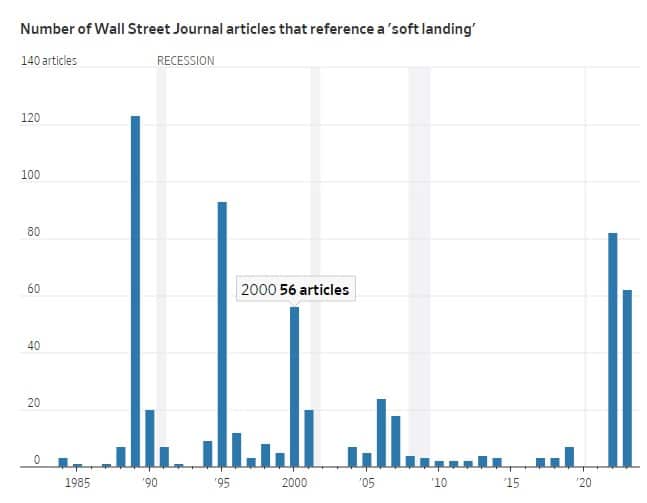
While the current economic data suggests that the economy is doing fine, such is always the case just before the realization it’s not. So far, the markets have continued to place “hope” on the extremely elusive “soft landing” scenario. However, there are many risks to that view, as noted. As the WSJ said:
“Similarly, this summer’s combination of easing inflation and a cooling labor market has fueled optimism among economists and Federal Reserve officials that this elusive goal might be in reach. But soft landings are rare for a reason: They are tricky to pull off.“
The reason is that many factors have yet to reveal themselves. Such as:
- The Fed’s aggressive rate hiking campaign has a “lag effect” that will impact the economy in 2024.
- The restart of the student loan payments will extract spending from the economy.
- A potential Government shutdown could clip growth heading into the end of the year.
- The autoworkers strike could have an impact on growth.
- Higher interest rates weigh on consumption, which is nearly 70% of the economic equation.
Furthermore, from a purely contrarian point of view, the experts no longer consider a “recession” a risk.
As we quoted previously in 2022, when “everyone” was expecting a recession:
“When all experts agree, something else tends to happen.” – Bob Farrell.
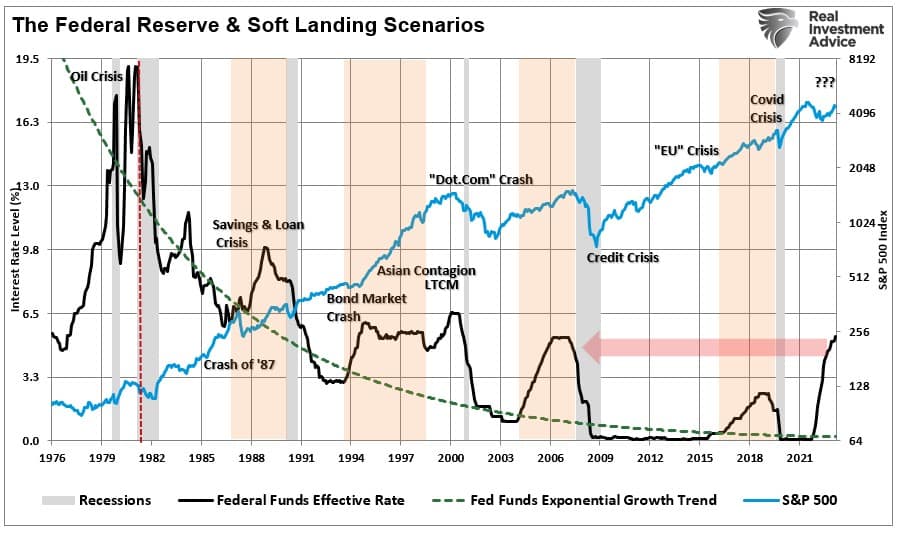
Historically, the Fed has always gone too far when hiking rates. Take a look at the chart below.
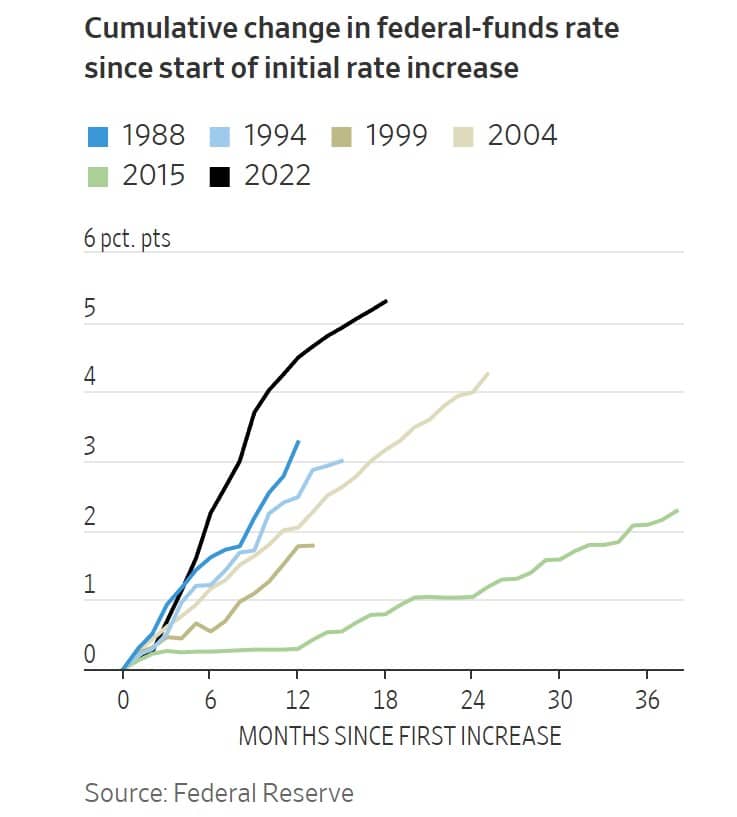
What this chart doesn’t tell you is the following:
- 1988 – Led to a recession in 1991
- 1994 – Led to a crash in the bond market.
- 1999 – Preceded the Dot.com crash and recession
- 2004 – Led to the Financial Crisis
- 2015 – Preceded the EuroZone crisis and the Fed’s Taper Tantrum
- 2022 – Recession in 2024?
Sure, this “time could be different.” The problem is that, historically, such has not been the case. While we must weigh the possibility that the Fed is correct in its more optimistic predictions, the probabilities still lie with its previous track record and the indicators.
Lance Roberts
No comments:
Post a Comment