Starting on July 22, 2011, the stock market went on a steep skid — falling nearly 17% in 17 days. The government did not default... but something equally "unthinkable" happened along the way: The bond-rating arm of Standard & Poor's downgraded U.S. government debt from a pristine AAA rating to AA+.
This was what happened 10 years ago, so it is history. But will history repeat itself now? Well, we have reason to believe something similar is in the cards this summer. I will share more when the developments start to emerge.
Right now, traders are facing a conudrum where the market price actions are persistently bullish but the underlying technicality is increasingly bearish. So it is not easy to trade purely based on TA as it will fool you more often than not. But it does not mean this will continue forever! After all, sanity will come back to the earth sooner or later. Actually the current divergent phenomenon often occurs during the dawn prior to a major decline. No one knows for sure when the turning point will come but the risk is increasingly higher now.
For today, let me just share a simple technical indicator that is predicting a major decline eerily consistent with the timeframe of the historical crash in 2011!
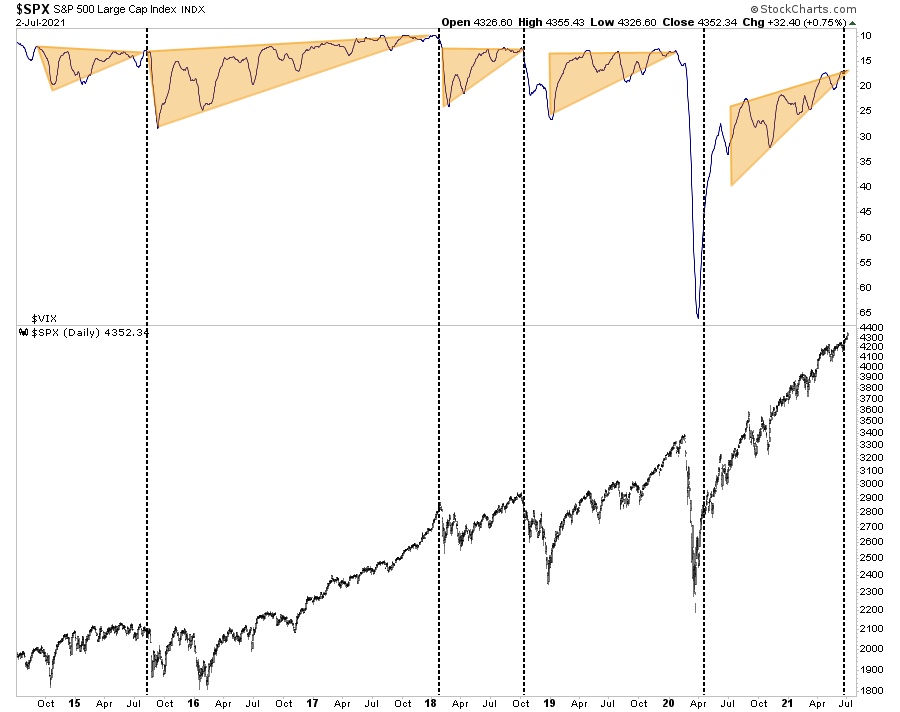
"Currently, complacency has reached more extreme levels. As noted last week, the 15-day moving average of VIX, on an inverted scale, suggests a correction is likely. By this measure, the correction should begin somewhere around July 21st – August 10th."
No comments:
Post a Comment