As I said, the current market turmoil is quite similar to that in Aug 2011, we can learn a lot from that experience to extrapolate what may be the roadmap for the current market in the next few months. As we often say, the history may not repeat itself, it often rhymes. So don't take it literately as the exact course of moves but a rough pathway for the near term market price actions.
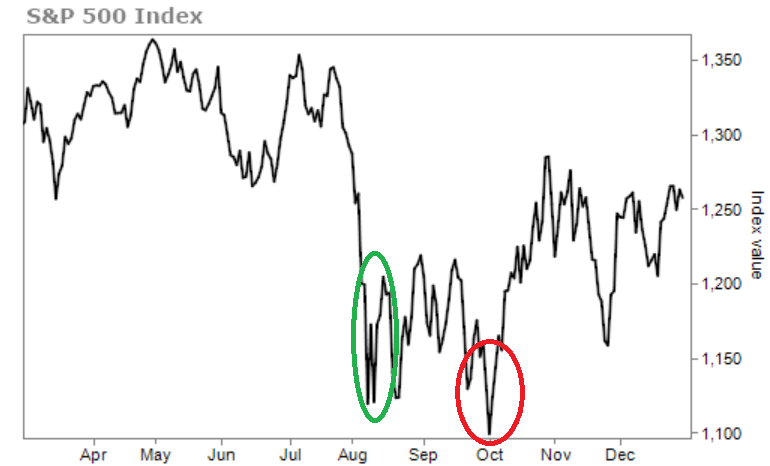
While judging by the severity of the current depressing sentiment, I truly believe we are very close to the bottom, if not already in it. Also, please be aware, the bottoming is a process, not a specific price point. It usually takes a few weeks at least to complete the bottoming process. The chart below represents the S&P prices around Aug 2011. As you can see, the market got into a very volatile period with a wide swings for quite a few weeks before it finally started to establish an uptrend. We are likely just at its very initial phase of the volatility (the green circle). There is a good chance we are going to see a low testing in the days or weeks ahead (the red circle). The true bottom is usually established when a low testing accompanied by a positive divergence from the TA perspective, which is something we haven't seen clearly on the daily chart. It will probably take a few more up and down wide swings to complete this process. This week's wild swings have stimulated a lot of volatility with DOW moving 1000+ points a few times. It felt like there was a big move for the market but actually the market virtually did nothing for the week. The two obvious support levels (2950 closing low and 2850 intraday low) are important to be held for a solid bottom to be built up. If it fails, then more severe downside will kick in. For the moment I believe they will hold but I can be wrong. In a highly emotion-charged market, anything can happen. So take my assessment with a grain of salt😷😎
No comments:
Post a Comment