* The Nasdaq market cap loss in 2022 through the end of April, it has worsened since, was $7.5 trillion compared to a loss in the Covid sell-off of $4.5 trillion, the dot.com collapse of $4.6 trillion, and only $2.5 trillion loss in the great financial crisis of 2007-09. Startling.
* Nearly everyone has degrossed and derisked. Per Lee Cooperman the S&tP 500 Index can fall 40% from the high if we have a recession. Or consider Dan Loeb, one of the greatest investors ever – in his Third Point first quarter letter to investors he said he was over 75% net long at year end, 41% net long at the end of the first quarter and only 23% net long last week!
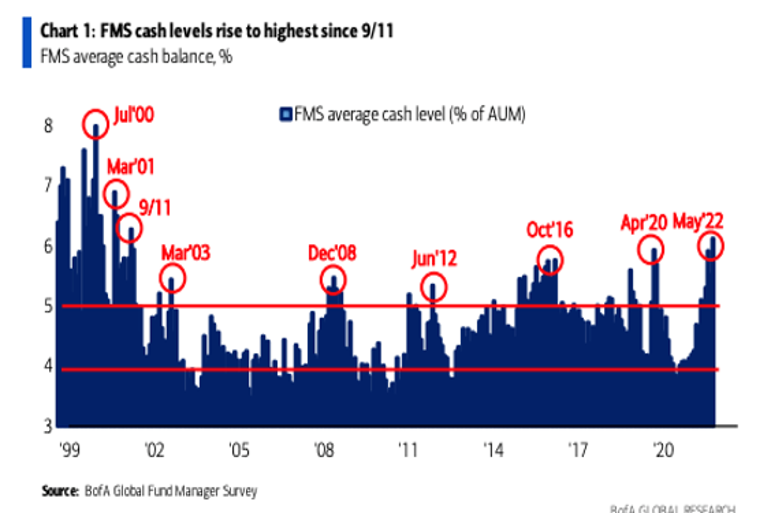
* Cash levels are higher than at the height of the pandemic:
|
* As discussed with Tom Keene and Paul Sweeney yesterday, at the end of April (again it has worsened in May) the 60 (stocks)/40 (bonds) strategy was -12% year to date. The worst performance in the last century and 3x worse than the second worst year (-4%)!
* Last week Investors Intelligence indicated that Bulls fell to just 29.8, the lowest since early 2016 while Bears rose to 40.8, the highest since March 2020.
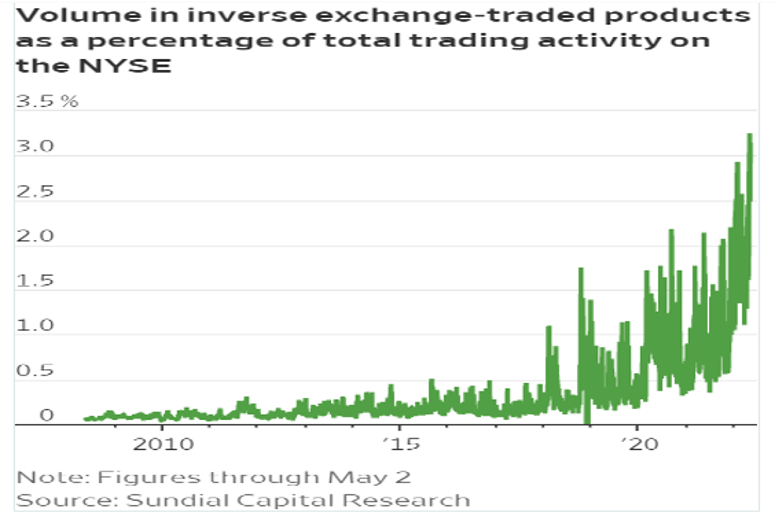
* The volume in inverse ETFs (at 3.25% of total trading) is at an all-time high.
|
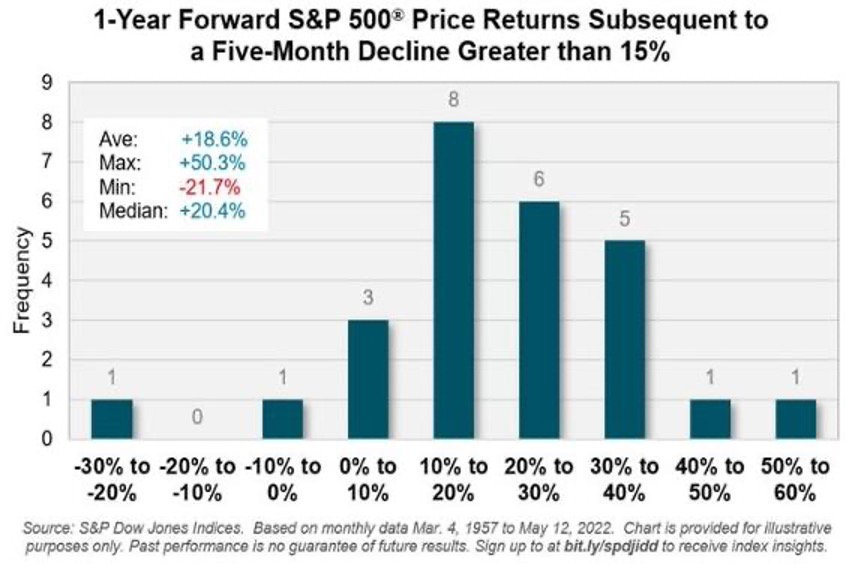
* Going back to 1957: a decline of 15% or more for the S&P 500 Index has been followed by positive returns in the ensuing 12 months in all but two occasions over the past 65 years.
|
* As of the end of April, more than 29% of issues on the NYSE had hit a 52-week low. On the Nasdaq, it was more than 33%. There have been only 18 similar days since 1984. The S&P 500 showed a loss a year later once, for -0.2%. Its median return was +32.0%.
* The S&P Oscillator is deeply oversold at -7.13% and the CNN Fear and Greed Indicator is expressing extreme fear (at 9/100).
No comments:
Post a Comment