LEGAL DISCLAIMER Please note everything discussed at this site is a personal opinion of the author and may contain errors or omissions. NO MATERIAL HERE CONSTITUTES "INVESTMENT ADVICE" NOR IS IT A RECOMMENDATION TO BUY OR SELL ANY FINANCIAL INSTRUMENT. It would be your sole responsibility for actions you undertake as a consequence of any analysis, opinion or advertisement on this site.
Total Pageviews
Tuesday, February 28, 2023
Why is ChatGPT so powerful and smart?
Friday, February 24, 2023
Friday, February 17, 2023
Has the next leg down started?
- The Federal Reserve Bank of New York's Household Debt and Credit Report showed consumer credit card balances hit a new high of $986 billion as inflation and high rates hurt disposable income.
This is kind of the current situation we are in regarding the general financial status for Americans. Basically, overall we are living on the sea wave of debt, which is not a great situation for the stock market going forward. Of course, the market has its own mind and it may simply defy gravity by going up regardless.
For me and DW Family we just use the gyrations of the market to make money, regardless of which direction. Today is another great day for us, not only for the fantastic overnight trade, but we have also nailed the intraday strong rebound, which allows us to create a great trade for the dead cat bounce.
For now, just want to share an analysis regarding the current market status. Be careful!!
************************************************************************************
Take a look at this chart of the NYSE McClellan Summation Index (NYSI) mapped along with its 9-day exponential moving average (EMA – blue line)…

This Summation Index is another technical tool for measuring market momentum.
Whenever the NYSI rallies above its 9-day EMA, it indicates that momentum is turning higher – and that's usually a good time to buy stocks.
Whenever the NYSI falls below its 9-day EMA, momentum is waning. That's usually a good time to sell.
The red arrows on the chart show the sell signals over the past year. Here's how those sell signals lined up with the S&P 500…

All four of the previous sell signals led to an immediate decline in the broad stock market.
Some declines were mild – like the 6% drop in December.
But the sell signals last April and last August were much more significant – swiping more than 600 points off the index.
The NYSI just generated another sell signal. There's no telling if this signal will lead to a mild decline or if we're headed for something more significant.
Either way, though, there's a good chance stocks are headed lower in the weeks ahead.
Thursday, February 16, 2023
A spectacular tug war!
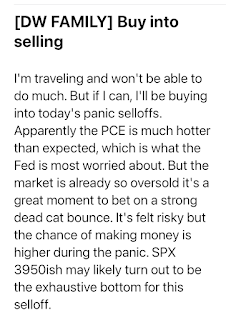
It has been really an amazing market to watch and trade. Here is the note I sent to DW Family before opening today.
And we did closed both overnight trades for very nice gains.
But the excitement has not stopped here.

