| Millions of Europeans are struggling to heat their homes right now... Take Henry Backhaus, for example. The 65-year-old German man used to buy natural gas through a private gas distributor. But then, Russia's war in Ukraine sent prices soaring across Europe. Now, the private gas company can no longer afford to buy natural gas. So it dropped Henry as a customer. That gave Henry no choice but to work with the local utility to get his natural gas. The problem is, the local utility wanted Henry to pay the equivalent of $850 for the first month alone. That's more than he previously paid to heat his home for an entire year. So... Henry fired up his wood-burning stove. Thousands of folks across Europe are doing the same thing. Unfortunately, that's not an option for everyone. Many people simply need to pay the higher costs. Folks, we're on the edge of summer here in the U.S. But winter will be here again before we know it. And America is closer to facing Henry's reality than you realize. Today, I'll explain how natural gas prices could potentially quadruple from here... In the U.S., we've enjoyed lower energy prices for decades compared with our overseas counterparts. Natural gas in Europe costs $30 per million British thermal units ("MMBtu") today. And it has been as high as $45 per MMBtu. Here in the U.S., prices just passed $9 per MMBtu. Now, things are a little different in America. Historically, foreign pricing issues don't bother us. That's because North America is vertically integrated... Natural gas is either produced in the U.S. or brought in from Canada. It's easy to access. So we've benefited from a foreign-pricing buffer in the past. Even better, the shale boom led to an abundant supply. Growing shale production easily exceeded demand. The surplus led to lower prices and a stable outlook for the past 15 to 20 years. However, that's changing now. And we should prepare for the worst... I wasn't joking about burning wood to heat your home. It's happening in Germany already. And with U.S. natural gas prices already surging, it could become our reality next winter... Gas prices are already up more than 100% in 2022 here in the U.S. And the market is tighter than some realize... In fact, the U.S. only recently became a natural gas exporter. And our surplus is relatively small compared to our consumption... Specifically, in 2021, our surplus only exceeded our consumption by about 13%. Nearly all of that surplus is tied up in exports. Sure, we benefit from our gas-rich shale deposits. But low prices have slowed production. And the U.S. simply wasn't prepared for the kind of market we're seeing right now... It takes a long time for production to ramp back up. You can't just flip a switch to turn it on. The energy space is also facing pressure from climate-change enthusiasts. As a result, not as much capital is flowing in for oil and gas producers. And no matter where you stand on the issue, the fact is simple... policy changes hurt investment in the oil and gas industry. Then, you need to add in increasing headwinds due to labor shortages and more. And suddenly... it's a recipe for disaster. Folks, keep your eyes on the energy sector today. We might be burning wood to heat our homes sooner than you think. Good investing, Pete Carmasino |
LEGAL DISCLAIMER Please note everything discussed at this site is a personal opinion of the author and may contain errors or omissions. NO MATERIAL HERE CONSTITUTES "INVESTMENT ADVICE" NOR IS IT A RECOMMENDATION TO BUY OR SELL ANY FINANCIAL INSTRUMENT. It would be your sole responsibility for actions you undertake as a consequence of any analysis, opinion or advertisement on this site.
Total Pageviews
Saturday, May 28, 2022
You Might Need to Burn Wood for Heat Soon
Friday, May 27, 2022
Bad Market Years Usually Lead to Good Ones
There's blood everywhere in the markets. And it doesn't look like stocks will recover anytime soon.
The Wall Street Journal warns we could be looking at a "Lost Decade for Stocks…"
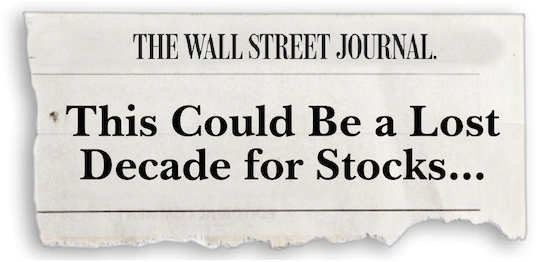
And MarketWatch.com says we're in for a "summer of pain."
According to the latest MLIV Pulse survey of 1,000 investors, the market will bottom around 3,500. That's a further 10% drop from the current level. Throw in the fact that CNN's Fear & Greed Index is now at 13 (on a scale of 1 to 100), which puts it in the "extreme fear" area. And the CBOE Volatility Index (VIX) remains above 30 - a very high anxiety level indeed.
All those sentiment measures indicate a pessimistic and fearful market that will see another leg down this year before putting in a bottom.
Macroeconomic factors (persistent inflation, Federal Reserve rate hikes, etc.) and geopolitical concerns (the war in Ukraine and the resulting high oil prices, Chinese lockdowns, etc.) would certainly seem to corroborate that outlook.
But here's the good news.
Very bad years for the market tend to be followed by good years.
You can see exactly that in the chart below, which shows the magnitude of the market's gain or loss (as measured by the S&P 500) every year since 1928.
Most - though not all - of the most dramatic market drops are followed by up years. Take a look for yourself...
 |
And here are the actual figures, as computed by Ben Carlson of Ritholtz Wealth Management...
- After the 11 worst years in the U.S. stock market, the average gain the following year was 6.4%. The market was down five of those years.
- For the three years following those 11 worst market years, the market was up an average of about 35%, and there was only one negative period among those (after the 25% drop in 1930).
- And for the five years following those 11 drops, the market was up almost 80%. It was positive for every one of those five-year periods.
So if that MLIV survey is right and the market drops another 10% this year, this bear market will be a drop of 27% from the S&P 500's January high.
Which would make 2022 the fourth-worst calendar year for the market on record.
Still, history suggests that the market will see a modest gain in 2023 - and that you are likely to recover your bear market losses within three years and see very solid returns over the 2023-2027 period.
Thursday, May 26, 2022
A decline in housing prices is unlikely
I got this from my friend, which may be interesting to some of you.
The U.S. housing market has been on fire since it bottomed during the global financial crisis...
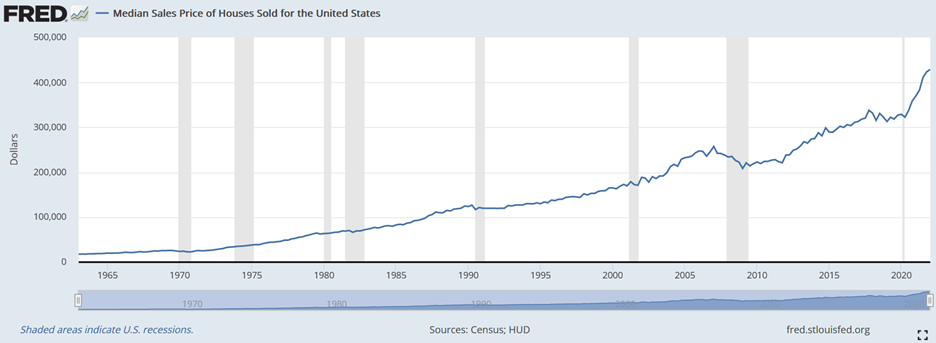
The median sales price of a home reached an all-time high of $428,700 in the first quarter, more than double the low of $208,400 in the first quarter of 2009, as you can see in this chart going back to 1963 (source: the St. Louis Fed):
|
However, many folks are concerned that housing prices may fall, due mainly to rising interest rates, though they are still low by historical standards, as you can see in this chart (also from the St. Louis Fed) of the rate for a 30-year fixed rate mortgage:
|
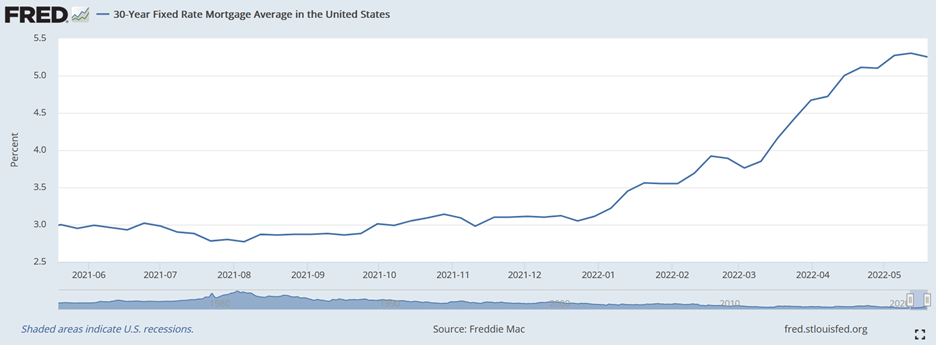
However, if we zoom into the past year, you can see that after reaching an all-time low of 2.77% last August, the average rate has nearly doubled to 5.25% today:
|
This obviously has a huge effect on what someone can afford to borrow and therefore pay for a house.
But will it be enough to cool the housing market – or even cause a crash?
My take: Yes to the cooling, but a decline in housing prices is unlikely, for reasons outlined in this in-depth Wall Street Journal article: Fed Searches for the Magic Number to Cool a Red-Hot U.S. Housing Market. Excerpt:
With a nudge from the Fed's recent interest rate increases, mortgage rates have risen almost 2.3 percentage points since November to 5.25% last week, the steepest rise in a six-month-span in decades. In the past, that kind of increase was usually enough for home buying and construction to fall sharply. Yet home prices could still hit new highs, even with sales starting to fall. Economists at Goldman Sachs (GS) estimate housing prices will grow around 10% this year; Bank of America (BAC) forecast 15%.
"This is a market as resistant to higher interest rates as you could possibly imagine," said Christopher Thornberg, founding partner at Beacon Economics in Los Angeles. "This is not a market that 5% interest rates are going to scare at all."
That leaves the Fed to decide how far and how fast rates need to go up to make a dent in the housing market without triggering a painful economic slowdown. Housing has been a traditional battleground in the fight against inflation because it is sensitive to interest rates and makes up a significant part of the U.S. economy. For nearly a decade, mortgage rates below 5% gave buyers the leeway to purchase more expensive homes. Rising rates weaken that purchasing power...
Economists and those in the real-estate industry have explanations for the unrelenting demand and minimal supply accelerating housing prices nationwide: millions of Americans in their 20s and 30s reaching peak home-buying years, more work-from-home jobs in the pandemic, increased competition from investors and too little housing built in the past decade.
Homeowners also have an incentive to stay put. Many don't see where they can afford to move. In April, the monthly mortgage payment on the typical home jumped to $1,475, assuming a 30-year fixed-rate mortgage with a 20% down payment, according to Zillow (Z). That is up 34% since December and 53% from April 2021...
... fewer than 10% of 1,500 prospective buyers surveyed this year said they would stop their home search because of rising mortgage rates. Shoppers in a 2018 survey, the last time mortgage rates rose to 5%, were twice as likely to say they would pull back.
"We wanted a house no matter what," said Kendal Strong, a 31-year-old hairstylist...
Real-estate professionals said employer permission for many white-collar employees to work remotely has allowed buyers to seek housing in more distant, less expensive locales. That helped lift demand for housing – and prices – in more affordable cities and towns.
"If you think you're going to cut home-buying demand, just instantly, by raising rates, that works so much better when someone was looking in San Francisco and had to stay there," said Glenn Kelman, chief executive at Redfin. "But when mortgage rates go from 3% to 4% to 5%, people can just go from San Francisco to Ohio, to Arkansas, to Louisiana"...
Home builders have increased production but are hamstrung by volatile material costs, supply-chain troubles and shortages of skilled tradespeople and available land. "The Fed is determined to put out this fire," Douglas Bauer, chief executive at Nevada-based home builder Tri Pointe Homes Inc., told analysts last month. "But there is just no supply."
For the decade following the 2007-2009 recession, new-home construction in the U.S. slowed. The homeowner vacancy rate has since fallen to 0.8%, the lowest in 66 years of record-keeping. The rental vacancy rate is near its lowest level since 1984. At the end of April, 1.03 million homes were listed for sale nationally, equal to a 2.2-month supply at the current sales pace, compared with a historical average of 5.7 months for that time of year, according to NAR.
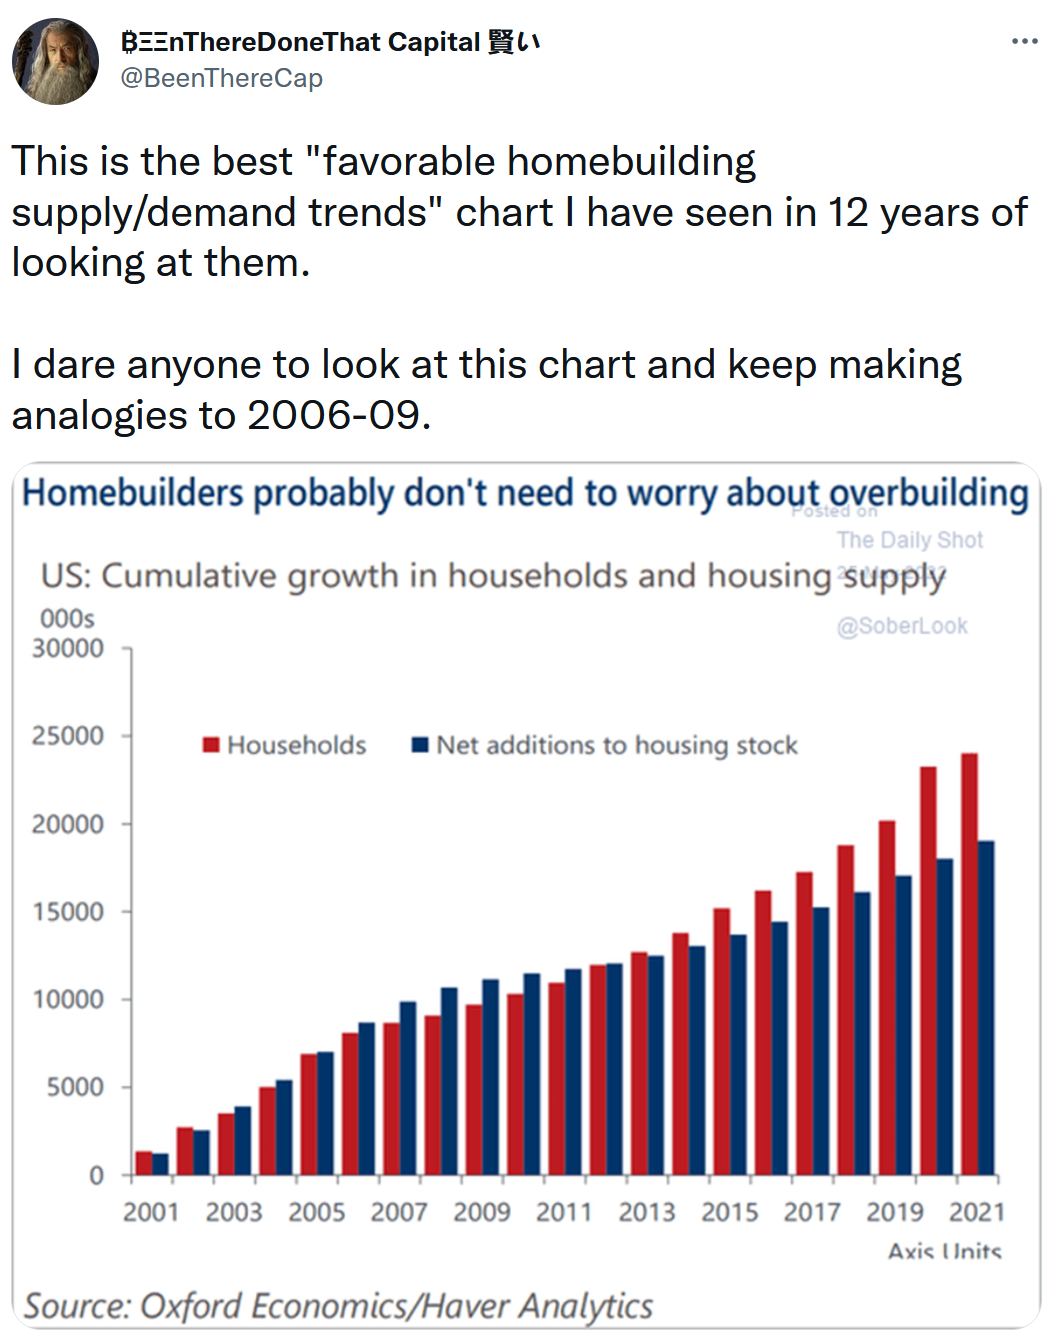
Here's another interesting chart someone tweeted:
|
For an in-depth dive into the housing market, here is this five-part series by Voss Capital, The Big Long? A Deep Dive on U.S. Housing:
- Part 1 – Where Is the Inventory?
- Part 2 – What's Driving Demand?
- Part 3 – Homeowner Balance Sheets and Historical Declines in Home Values
- Part 4 – What Slow Down? Recent Commentary from Builders and Building Product Companies
- Part 5 – Affordability
Excerpt:
In our view, the current housing market is a textbook example of supply and demand imbalances driving up prices. The demand that has resulted in bidding wars and rapid home price appreciation isn't coming from euphoric real estate speculation. The ongoing wave of demographic driven demand is crashing into a structural housing supply shortage after we spent over a decade underbuilding following the financial crisis. While we don't want to try to predict housing prices, we think the calls for a housing price crash on par with or even worse than 2007/2008 are sensationalistic as we believe there is a strong demand floor for the foreseeable future...
While we agree that affordability is something to keep an eye on and quickly becoming a concern in some markets, much of it stems from the supply/demand imbalance we entered 2020 with rather than rampant speculation or anything of the sort. The good news is that homebuilders are building where people want to live, where the demographics support it and where employment is growing. Despite persistent supply chain issues continuing to slow down the pace of completions there are currently more than 800,000 single family home under construction. This provides a line of sight to much needed new supply which should serve to help correct the supply/demand imbalance and ease the rapid home price increases in the most in demand cities.
Tuesday, May 24, 2022
Getting Fired Takes Hard Work
This is a funny/insightful Wall Street Journal article that speaks to how tight the labor market is: In This Economy, Getting Fired Takes Hard Work. Excerpt:
To hold down a job these days, a worker seemingly needs one essential trait: a pulse.
Some jobs have always required little more than the ability to stay awake. In the tightest labor market in a half-century, people in higher functions may get by just going through the motions, too.
"You'd have to be incredibly lousy" to get fired as a software engineer at the moment, says David Cancel, who employs roughly 700 people as chief executive of Drift, a Boston-based marketing firm that uses artificial intelligence. "Most companies – and us, in some cases – are keeping people who wouldn't be on the team in a looser market. The standards would be higher."
Though some economists warn of a coming downturn, layoffs and discharges in recent months have registered at or near all-time lows, according to the Labor Department. Less than 1% of workers are getting pink slips, roughly half the norm, with job security especially sweet in finance, education, healthcare, and the public sector.
To those giving less than full effort or just not up to the job: Your boss probably knows it. But there's little guarantee of finding someone better anytime soon, so you'll likely keep cashing that paycheck.
Much as businesses love to tout their ambitious corporate cultures – and have many ways of tracking employees' productivity – some would gladly settle for mediocrity right now.
When the human-resources software company UKG recently surveyed about 2,000 managers, roughly two-thirds said they'd be willing to rehire middling former employees, and 16% said they'd take back anyone, regardless of skill.
"I call it bird-in-the-hand management," says UKG Vice President David Gilbertson, who leads the firm's workforce research. "The companies I talk to are all worried about recruiting."
Friday, May 20, 2022
Signs of capitulation
* The Nasdaq market cap loss in 2022 through the end of April, it has worsened since, was $7.5 trillion compared to a loss in the Covid sell-off of $4.5 trillion, the dot.com collapse of $4.6 trillion, and only $2.5 trillion loss in the great financial crisis of 2007-09. Startling.
* Nearly everyone has degrossed and derisked. Per Lee Cooperman the S&tP 500 Index can fall 40% from the high if we have a recession. Or consider Dan Loeb, one of the greatest investors ever – in his Third Point first quarter letter to investors he said he was over 75% net long at year end, 41% net long at the end of the first quarter and only 23% net long last week!
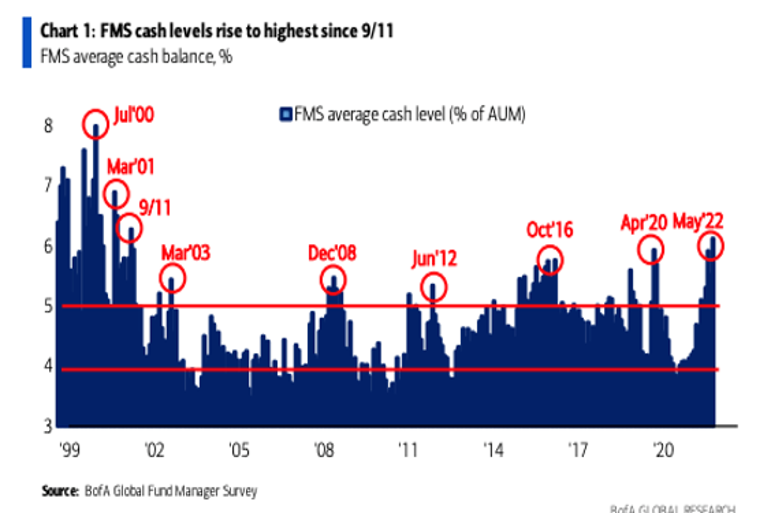
* Cash levels are higher than at the height of the pandemic:
|
* As discussed with Tom Keene and Paul Sweeney yesterday, at the end of April (again it has worsened in May) the 60 (stocks)/40 (bonds) strategy was -12% year to date. The worst performance in the last century and 3x worse than the second worst year (-4%)!
* Last week Investors Intelligence indicated that Bulls fell to just 29.8, the lowest since early 2016 while Bears rose to 40.8, the highest since March 2020.
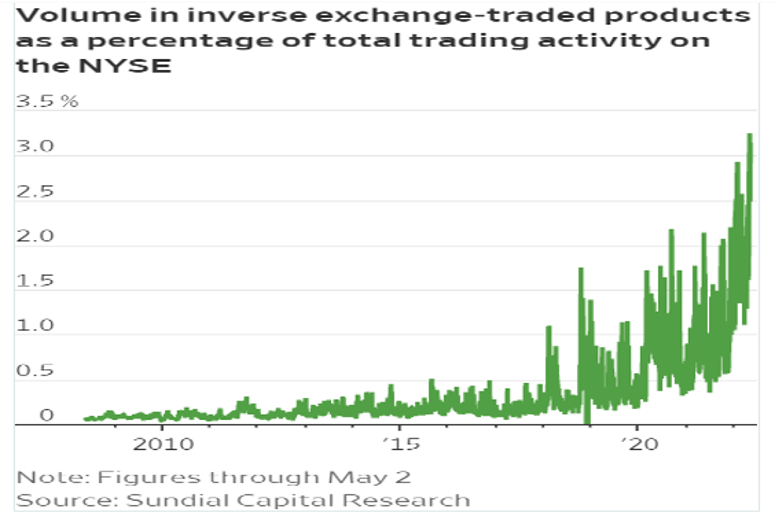
* The volume in inverse ETFs (at 3.25% of total trading) is at an all-time high.
|
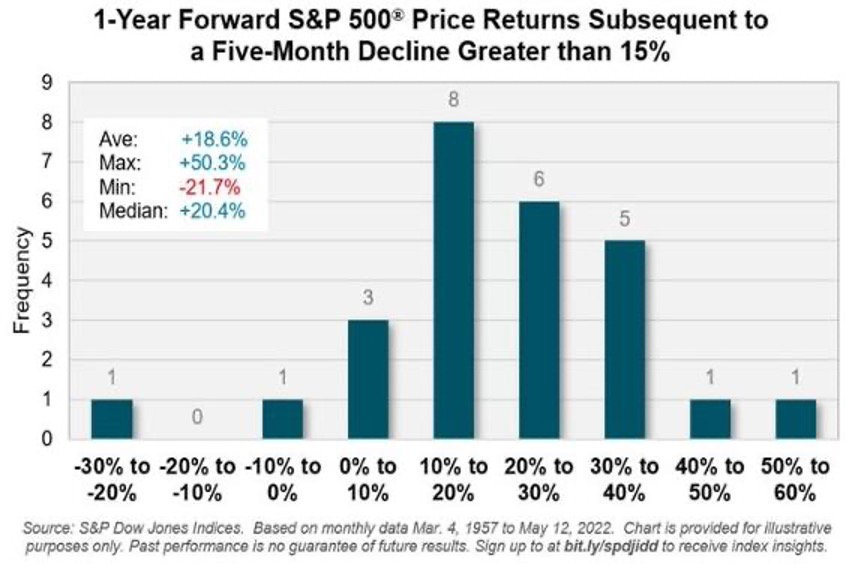
* Going back to 1957: a decline of 15% or more for the S&P 500 Index has been followed by positive returns in the ensuing 12 months in all but two occasions over the past 65 years.
|
* As of the end of April, more than 29% of issues on the NYSE had hit a 52-week low. On the Nasdaq, it was more than 33%. There have been only 18 similar days since 1984. The S&P 500 showed a loss a year later once, for -0.2%. Its median return was +32.0%.
* The S&P Oscillator is deeply oversold at -7.13% and the CNN Fear and Greed Indicator is expressing extreme fear (at 9/100).
Widespread pessimism as stocks suffer brutal selling pressure (by SentimenTrader)
|
|
|
|
Tuesday, May 17, 2022
Increasing values nicely even in the market turmoil
How to turn $100 to $1 million
NowRx is now the #1 campaign in SeedInvest platform history with over $23M raised from over 7,900 investors and that would not be possible without the incredible backing of our existing and potential future investors!
As we approach the final 3 days of what could very well be our last equity crowdfunding round, I'd like to pause and reflect on some of the amazing highlights we have been able to achieve with the help of the crowd over the last 5 years.
Since 2016, NowRx has been able to grow revenue from just under $700,000 to an annual run rate of over $32M while expanding to 8 operational locations with 5 more set to open in the next few months.
In addition, we've seen our share price value increase by over 1,600% for shareholders during that time while earning major industry awards and partnerships such as the 2021 Surescripts White Coat Award and our recently announced partnership with Hyundai Motor Group.
Below is the chart per its fundraising prices. While I missed its pre-Seed round but only invested its A and B round, still the share value has increased 3-4 times in the past two years or so. Given its momentum I feel great about its prospect. For the current C round that will close in 3 days, it is priced at $10.5. If anyone interested to learn more about this company, here is the link: https://www.seedinvest.com/nowrx/
Maybe someday it may really turn each $100 into some serious money, like $100K or $200K or even more. A wild dream for now of course but it is certainly not impossible.
More importantly, these private shares can offer peace of mind… and help us sleep well at night no matter what the stock market is doing.
Saturday, May 14, 2022
A poor child's tears may have suggested a bottom of this plunge....
The historically worst start of the year has driven most people into a deeply depressing hole. Here's a funny 77-second video about the carnage out there: Saving Capital Markets (warning: very graphic), vividly reflecting the current market status. But we may start to see a glimpse of the light from the bottom of the sinking hole.
Below is one anecdotal observation from a poor child's psycho changes from his trading adventure (forwarded by a friend):
On January 27 last year, only one day after the peak of the meme stock bubble (which I called the top of nearly to the hour), my friend texted me a crazy yet completely representative story about his young son, which I described in my e-mail the next day:
...for months [my] friend has been resisting his 11-year-old's pleas to lend him $50,000 to speculate on stocks – but he finally broke down and texted me last night:
At his request and from his account, I will purchase AMC (AMC) and GameStop (GME) for him tomorrow. He is literally bawling, PLEADING, and yelling at me:
TikTok tells me which stocks to buy. Every time you tell me something is risky, you are wrong. This time they are worth it and will go up! I want to buy more, I want to buy on margin. They will loan me the money. Please, please BUY ME MORE AMC ON MARGIN – I know it will go up!
The poor kid has, of course, been incinerated, as AMC and GME are down 44% and 74%, respectively, since then.
You won't be surprised to hear that my friend texted me this last night about his now-12-year-old son:
He just asked me: "What should I do now? Sell all my tech stocks and just buy index funds?"
I don't want to put too much weight on one kid's behavior, but just as his tears marked the top of the bubble a year ago, his capitulation may well mark the bottom today...
Friday, May 13, 2022
Falling prices are bullish now....

You see, history shows us that declining prices aren't always bad. Instead, when stocks hit a new 52-week low, it often sets us up for future gains. Following NASDAQ nearly 30% plunge, S&P 500 has also touched its 52-week low in years at the beginning of May. From its peak, it has shedded 17% by now. That's scary... But it is not necessarily bad. If you don't know, new 52-weeks lows are rare – they've only happened less than 1% of the time since 1950, or 23 times in the past 72 years. What happened following those new lows? Surprisingly good or even great:

Per history, stocks tend to perform well after such extreme lows, especially in the longer term with 2-3 years time period. In average, S&P returns shoot up to 24% in two years and the three-year return grows to 31.2%.
This is what I told me DW Family yesterday:
Will a reversal ever come?
Stocks seem to get hit… again today with S&P futures down 30 points or so. Nearly all the indicators I follow are extremely oversold. It may sound like a broken record for me to sing the same bullish music again and again everyday but believe me there will be one heck of a bounce coming at some point.
The million dollar question is of course When? And How sustainable will that bounce be?
My gut feeling tells me it will be… soon and probably lasting a couple of weeks, considering how deeply oversold the market is right now with historically depressed sentiment rarely seen.
Wednesday, May 11, 2022
We have seen this before......
We are witnessing the worst first quarter performance in 40 years. For many people, this feels like the end of the world, especially following year after year a stable uptrend and people are used to a market that seemingly never went down. All the sudden, it keeps going down, even 5 days in a row continuously. Well is the end?
Well, if you don't remember or are too young, here is the thing: what we're seeing in the markets right now is something that we've seen before. More specifically, there is a strong similarity between what is happening now and what happened in the fourth quarter of 2018. As a reminder, starting in 2017, the Federal Reserve began a series of seven straight Fed Funds rate hikes, of 25 basis points each, leading into the 2018 mid-term elections. This, not surprisingly, caused the Nasdaq to decline 23% in the fourth quarter. It really seemed to be well planned, especially considering what happened next. After the series of rate hikes, the Fed completely reversed course and pulled the Fed Funds rate down to basically zero in less than a year.
If the history repeats itself or even just rhymes, we may likely see something similar to happen again this time. I still believe the Fed can be very loud in voice but very limited in action. I seriously doubt they can raise interest rates much at the end before they start to pivot again!
Don't Let Emotions Control Your Investing (by Lance Roberts)
As Bob Farrell's rule number-9 states:
"When all the experts and forecasts agree – something else is going to happen.
As a contrarian investor, excesses get built by everyone being on the same side of the trade. Currently, everyone is so bearish that the reflexive trade will be rapid when the shift in sentiment occurs.
As Sam Stovall, the investment strategist for Standard & Poor's, once stated:
"If everybody's optimistic, who is left to buy? If everybody's pessimistic, who's left to sell?"
The takeaway from this commentary is not to let media headlines, financial narratives, or concerns over long-term issues like valuations, economics, or geopolitical events impact the decision-making process in your portfolio strategy.
Monday, May 9, 2022
Nothing out of ordinary
As Sam Ro noted for Yahoo Finance yesterday, this is a fairly average year. To wit:
"It's been an incredibly unpleasant year for stock market investors.
After setting a record closing high of 4,796 on January 3, the S&P 500 tumbled 13% to 4,170 on March 8. It then rallied to 4,631 on March 29, but then fell again hitting a closing low of 4,146 on Thursday, reflecting a max drawdown (i.e. the biggest intra-year sell-off) of 14%.
However, this year's moves are nothing out of the ordinary. Since 1950, the S&P has seen an average annual max drawdown of 14%."
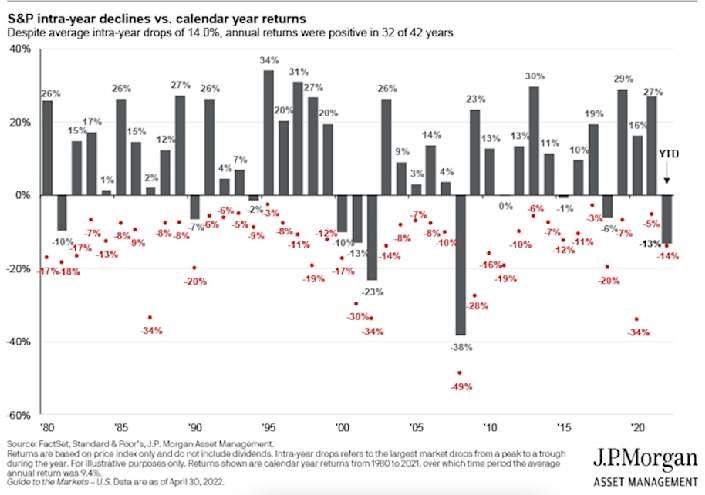
He quoted RBC Capital Markets on how markets reacted during four recent growth scares. RBC noted that the six-month returns ranged from 18.2% and 28.6% following market troughs. The 12-month returns ranged from 26.6% to 32.0%.
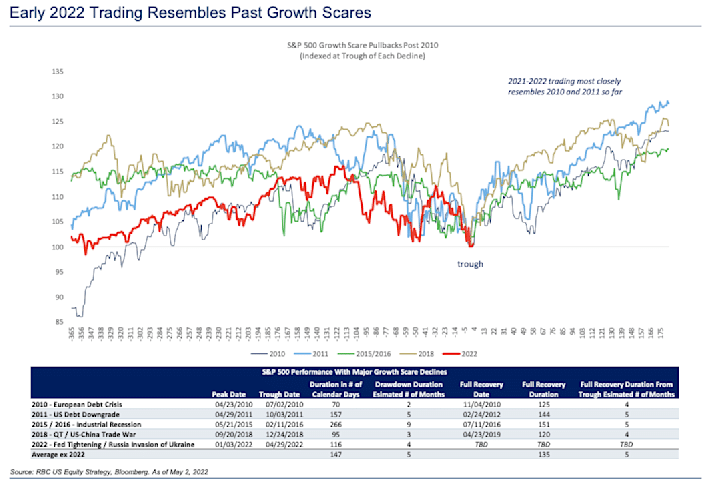
While it is easy to find a lot of reasons to be bearish, these data points help retain perspective and combat confirmation bias.
However, for now, the stock market rollercoaster continues.
- Lance Roberts
Friday, May 6, 2022
Wandering in the blood.....
Blood, Blood, Blood.....
Wherever you go these days, you are submerged into a fresh bloody river flooding down! You are also bombarded by the headlines like " 美股狂杀千点爆了 专家曝"致命原因"警告". Scary, right? Yes, but I see more and more opps right now. Remember Warren Buffett's famous maxim? "Be fearful when others are greedy and greedy when others are fearful". I'm just trying to do that🤗
While investors have been whipped into a frenzy about how devastating a half-point rate hike is going to be for stocks... cold hard facts paint a very different picture based on the historical data dated back to the 1950s. During this time, there have been 12 rate hike cycles, in which the S&P averaged an annualized return of 9%...
 |
More importantly, only one of those cycles yielded a negative return.
Don't get me wrong. I'm not saying there is no risk of a recession. Not at all. I think the recession risk is quite high actually and we may be well on the way going into a bear market. Nevertheless, the market rarely follows the herd's opinion and dances with them in sync. Even if a recession or a bear market is coming, it takes time with volatility. There will be up and down along the way. When at an extreme end, a reversal in either direction can be very violent and powerful, even in a "rip you face off" fashion, just like what we saw on Wed. Right now, I'm betting on another explosive dead cat bounce in the very near future, probably within days.
Thursday, May 5, 2022
Boost your 401K with Bitcoin
I love Bitcoin as you all know and I have bought GBTC in my IRA accounts. Now the very bullish news just broke out for Bitcoin, which should have a fundamentally strong long term wealth building effect for Americans. Actually I have thought about an idea for quite some time that Bitcoin may be one of the few only options available that may help solve the pension deficit crisis. Fidelity's move may be in a way to prove that!
***************************************************************
We'll wrap up today with a huge development from Fidelity. The brokerage giant just announced that it will allow investors to buy Bitcoin in their 401(k) retirement accounts. I can't overstate how big of a deal this is.
As we discussed last week, Fidelity is the largest traditional stock brokerage in terms of total accounts. In fact, Fidelity boasts 33.2 million client accounts.
So this announcement will put Bitcoin in front of millions of investors who may not have considered it before.
To be clear, it's just an option. Investors don't have to buy Bitcoin in their 401(k) if they don't want to. But to me, holding Bitcoin inside of a tax-advantaged account is a great way to go.
Perhaps it's no surprise that Fidelity's rollout will start with MicroStrategy.
MicroStrategy is an information technology (IT) company. But its chief executive officer (CEO), Michael Saylor, got the Bitcoin bug a few years ago and moved $425 million of the company's cash reserves into Bitcoin.
Saylor has since borrowed against the company's assets to invest even more heavily into Bitcoin. As I write, MicroStrategy owns 129,218 bitcoins. That's worth just over $5 billion today.
So Fidelity is starting with MicroStrategy's 401(k) services. And by summer, Bitcoin will be available to all of Fidelity's clients worldwide.
This is wildly bullish for Bitcoin.
The Fed can't raise rates
"The Fed can't raise rates." Piepenburg reasserts:
They simply can't. Because Volcker was in 1980 looking at 900 billion in national debt. Well, by 2022, we have 30 trillion in national debt. We can't raise rates. The fed will say they will. So they'll have something to cut when the markets crash. The reason the Fed is puffing their chest right now, folks, is because they know the market's going to crash.
They want to raise rates 25 bits here and there. So they have anything, something to cut when there's the next crash. And the crash is coming probably sooner than later. I can't time it. No one can. But you want to be ahead of that curve by not being loaded up in credits and equities that are correlated, they're going to tank together." [emphasis is added]
The Fed, as we'll come to see, has already made a policy choice. It favors inflation over recession. And the immediate response from the spigot-suckers on Wall Street, yesterday, was "yay!"
Today, the trepidation. Too bad, suckers.
We all have to suffer at the hands of bad policy. Still we believe the market will out… buy gold, real estate, commodities… take care of your family.
Addison Wiggin
Wednesday, May 4, 2022
More pain ahead in this sector.....
I borrowed the chart for today's blog.
XLF, the ETF for the financial sector, is presenting a classic textbook bearish head and shoulders pattern that completed last week
on April 26. This pattern often leads the stock down towards its next major support. At the moment, the obvious support is around $31ish as shown in the red line, whichis an important level for XLF. It represents a major top from which prices broke down in February 2020.
Markets have long memories. It's common for them to re-test past important levels like this one. So, I wouldn't be surprised if we test this level over the next week or two.Tuesday, May 3, 2022
“The Fed’s last experiment in tightening failed with a 20% stock market crash in the fourth quarter of 2018"
Jim Rickards reminds us.
"When the Fed started QT in late 2017, they urged market participants to ignore it. They said the QT plan was on autopilot, the Fed was not going to use it as an instrument of policy and that it would 'run on background' just like a computer program that's open but not in use at the moment.
"It's fine for the Fed to say that, but markets had another view. Analysts estimate that QT is the equivalent of two–four rate hikes per year over and above the explicit rate hikes.
"Not surprisingly, we had the Christmas Eve Massacre in December 2018, and Fed chair Jerome Powell was forced to begin easing policy again.
"The Fed quickly backed off and began cutting rates and printing money (through QE) in 2019 and early 2020.
I think this is the likely scenario of how this saga ends. But I don't believe it will be anything imminent. For tomorrow, I think it is more likely we will see some sort of fireworks following Powell's news conference after 2 pm. This is what my crystal ball tells me😜😇
