The 200-day moving average, as denoted in the chart above, is a technical indicator used to analyze long-term trends. The line represents the average closing price over the last 200 days. Each day, the average changes as the latest data point are added, and the first removed creating a new average price.
Given the 200-dma represents a longer-term holding period for stocks today, it is a more important indicator for "risk" management and capital preservation. As IBD notes:
"Making a decision on when to sell stocks to lock in a profit can be very tough, especially when you've amassed long or short-term capital gains. Watching the stock's behavior at the 200-day moving average can help you decide when it's time to take at least some partial profits."
One of the bigger mistakes that investors repeatedly make is not having a "sell discipline." They often hold a stock that is losing money hoping it will come back which weighs on portfolio performance due to "opportunity cost." Or, often worse, they turn a large gain into a loss trying to avoid paying "capital gains" tax.
These are easy mistakes to correct using the 200-dma and can improve portfolio performance over time.
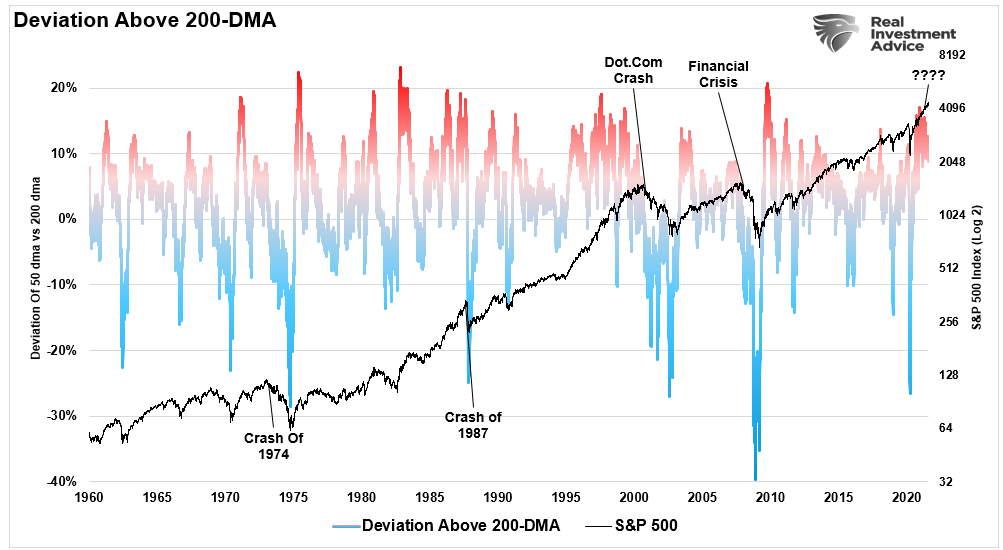
Deviations Above The 200-DMA
In the short term, fundamentals don't matter. Such is because over a few days, weeks, or even months, what drives prices higher or lower is the psychology of investors. As such, we can look at technical deviations to determine how exuberant or not the market currently is.
For moving averages to exist, prices must trade both above and below that average. As such, moving averages act like gravity on prices. When prices deviate too far from the moving average, eventually, prices will revert to, or beyond, that average.
"Reversion to the mean is the iron rule of the financial markets" – John C. Bogle
We can visualize the reversion in the chart below of the S&P 500 index versus its 200-dma. With the index currently more than 11% above its 200-dma, such should be a short-term warning to investors. Looking back historically whenever deviations exceed 10% above the 200-dma, a correction generally ensues.
Deviations Of Averages
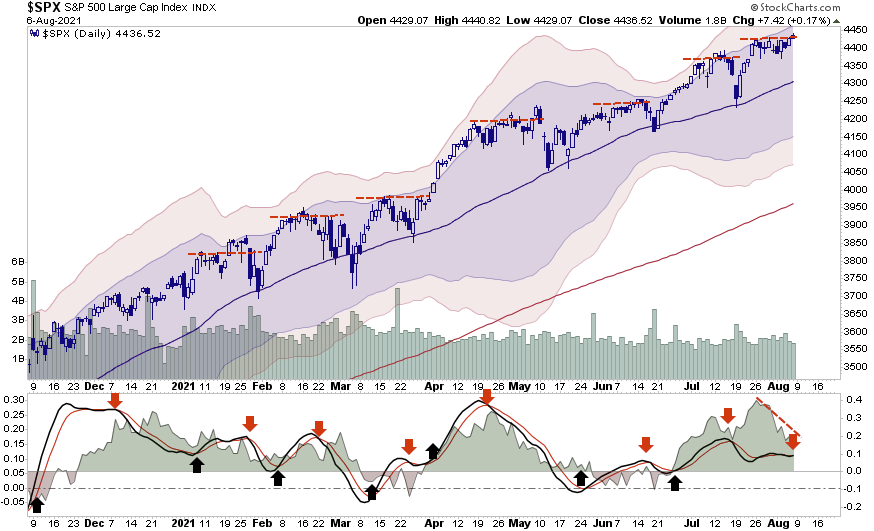
Since last November, the market has exhibited a period of extremely low volatility. During that period, the 50-dma has acted as an important support for the market as speculative buyers use minor "dips" to chase markets. Interestingly, these spurts of "dip buying" create a short-lived advance, price stagnation, and then a retest of the 50-dma.
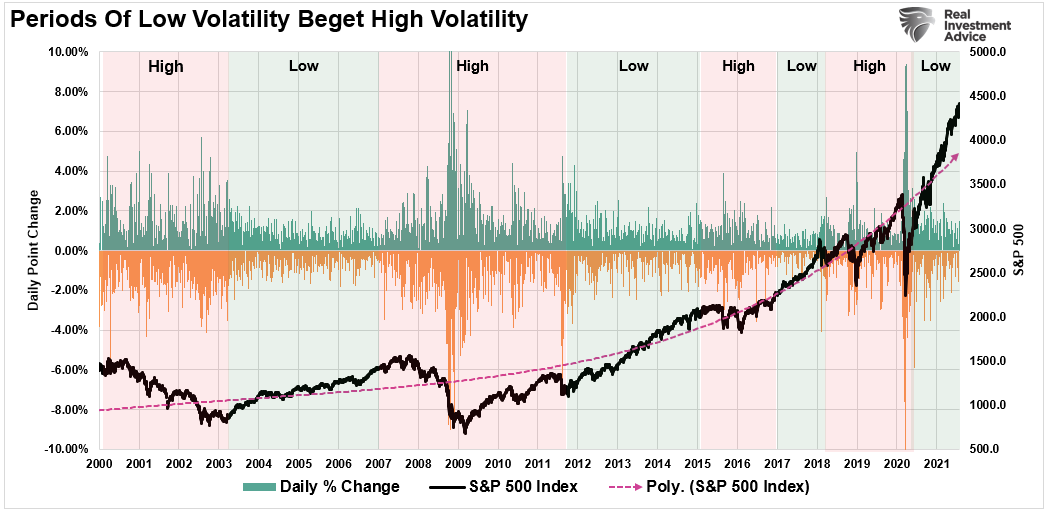
Of course, the suppressed level of volatility is always a warning. As discussed just recently, "Stability Leads To Instability." To wit:
"Given the volatility index is a function of the options market, we can also view these alternating periods of 'stability/instability' by looking at the daily price changes of the index itself."
The following chart says much the same. Currently, the 50-day moving average is also significantly deviated above the 200-dma. Such suggests that not only will prices retest the 50-dma, but there is a rising probability that price will revert to the 200-dma.
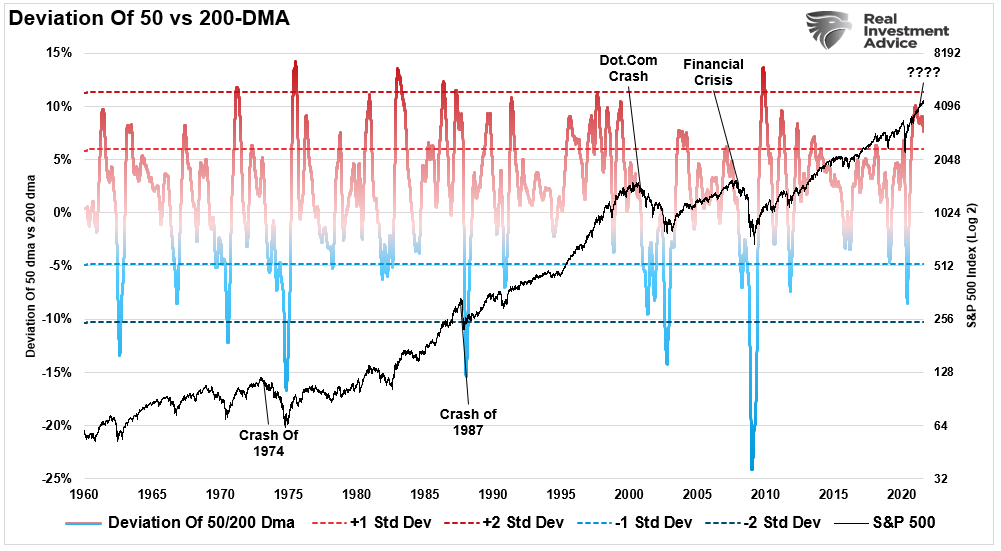
Notably, technical deviations in the short term do NOT mean the market will "crash" tomorrow. Markets can remain deviated for quite some time. However, when the deviations begin to diverge from the price index negatively, such has previously preceded more important corrections and bear markets.
It is something worth paying attention to.
No comments:
Post a Comment